Directory of Visualizations
Based on The R Graph Gallery


Map
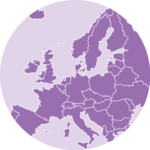


Map Choropleth Hexbin map Cartogram Connection Bubble map
- Visualizaton of geospatial data
- Usually, the map is just a reference
- Sometimes, it encodes the information
Map Map
< Contents | Many resources and examples at r-spatial.org
world <- giscoR::gisco_get_countries()ggplot(world) + geom_sf()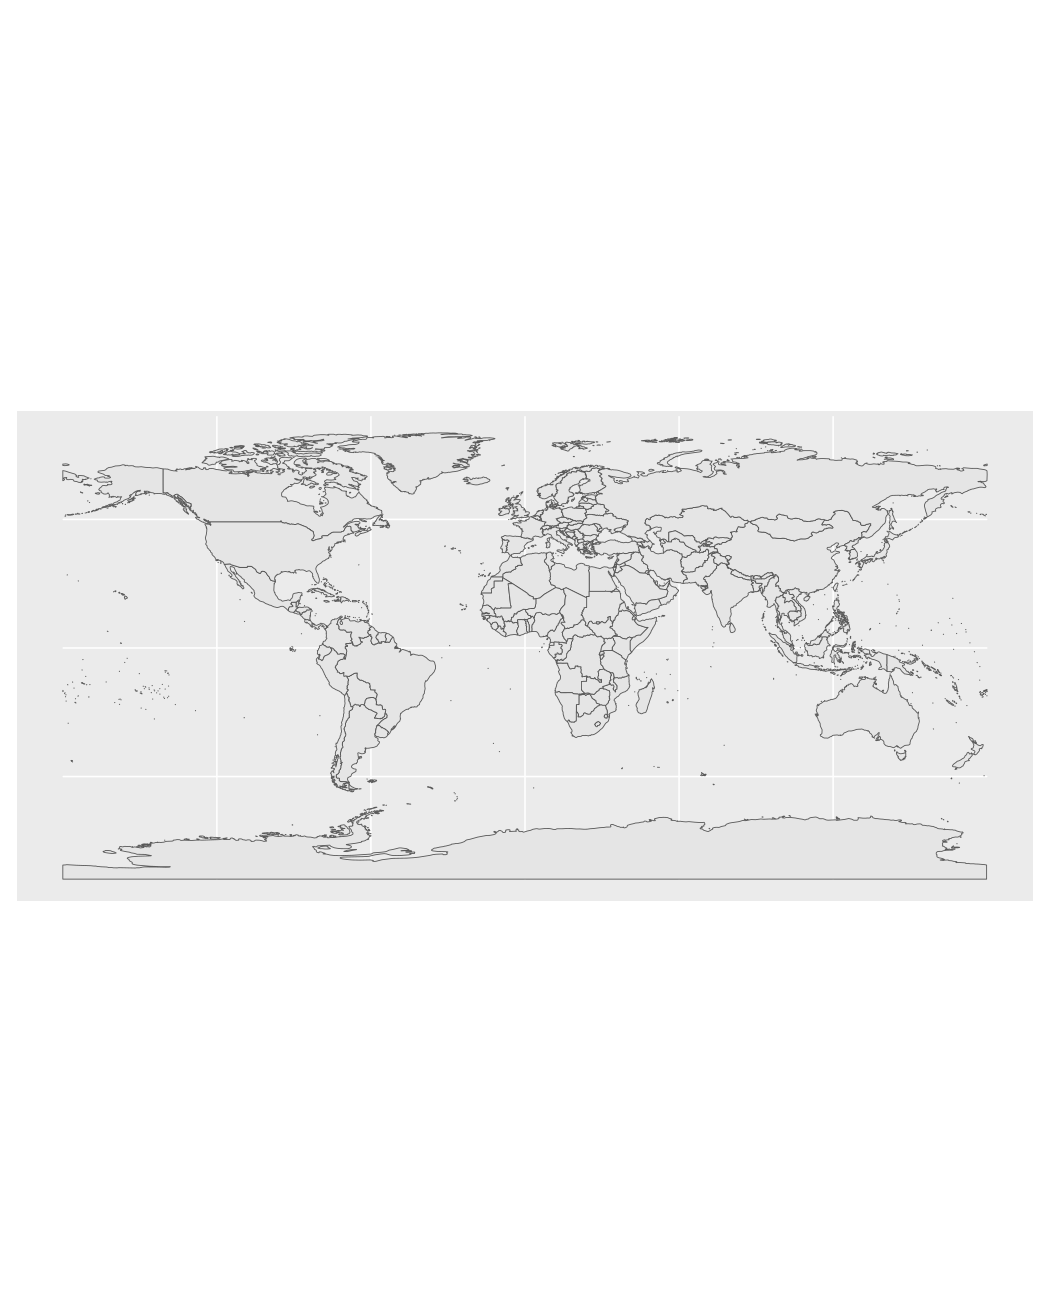
Map Map
usa <- sf::st_as_sf(maps::map( "state", plot=FALSE, fill=TRUE))ggplot(usa) + geom_sf()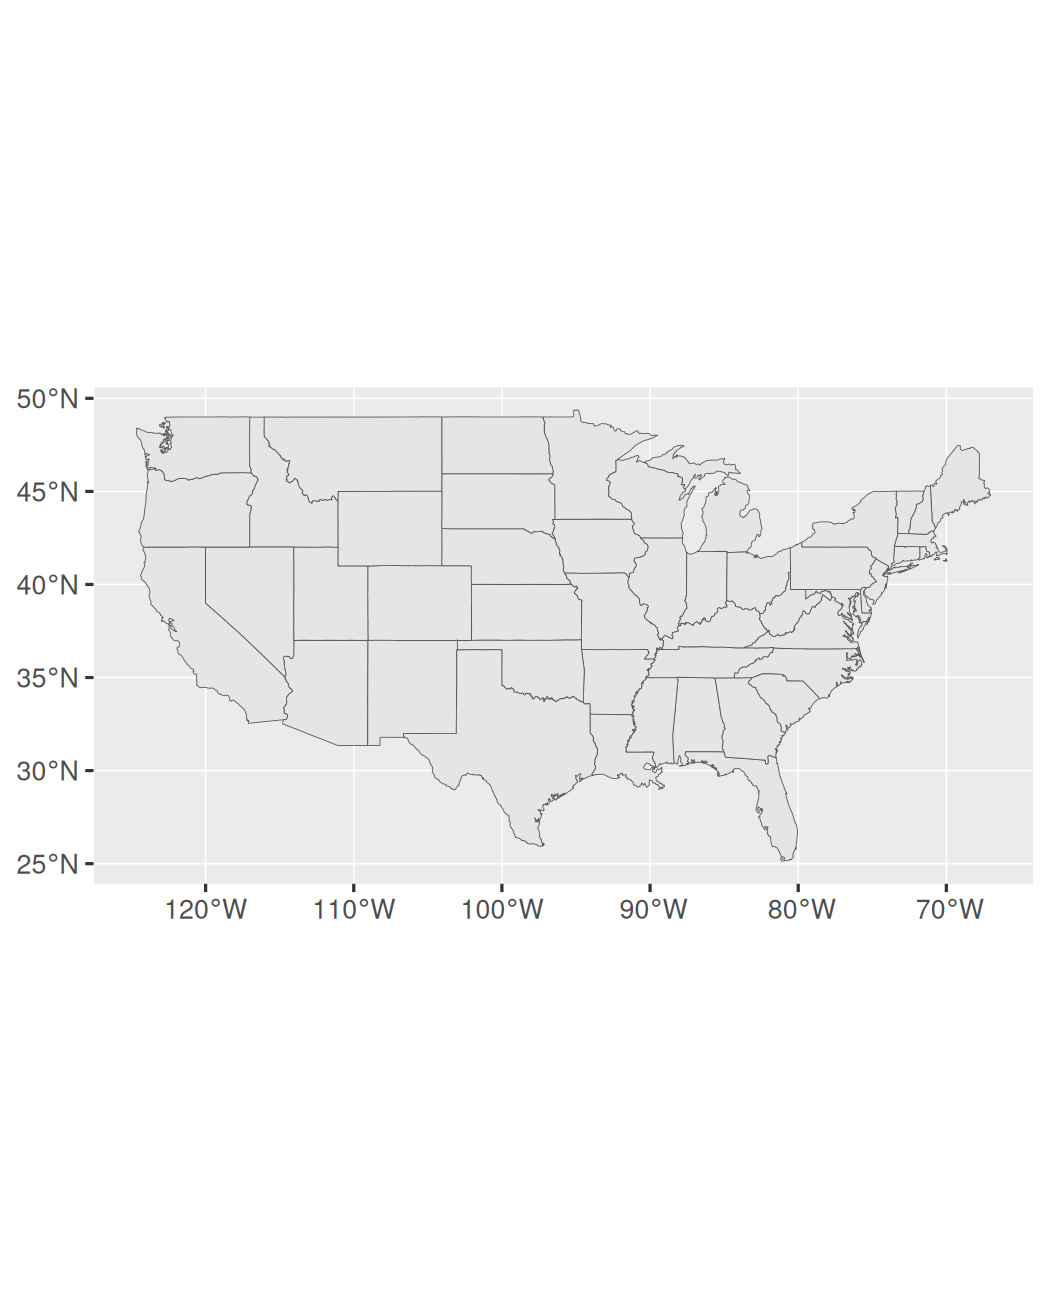
Map Map
africa <- giscoR::gisco_get_countries( region="Africa")ggplot(africa) + geom_sf()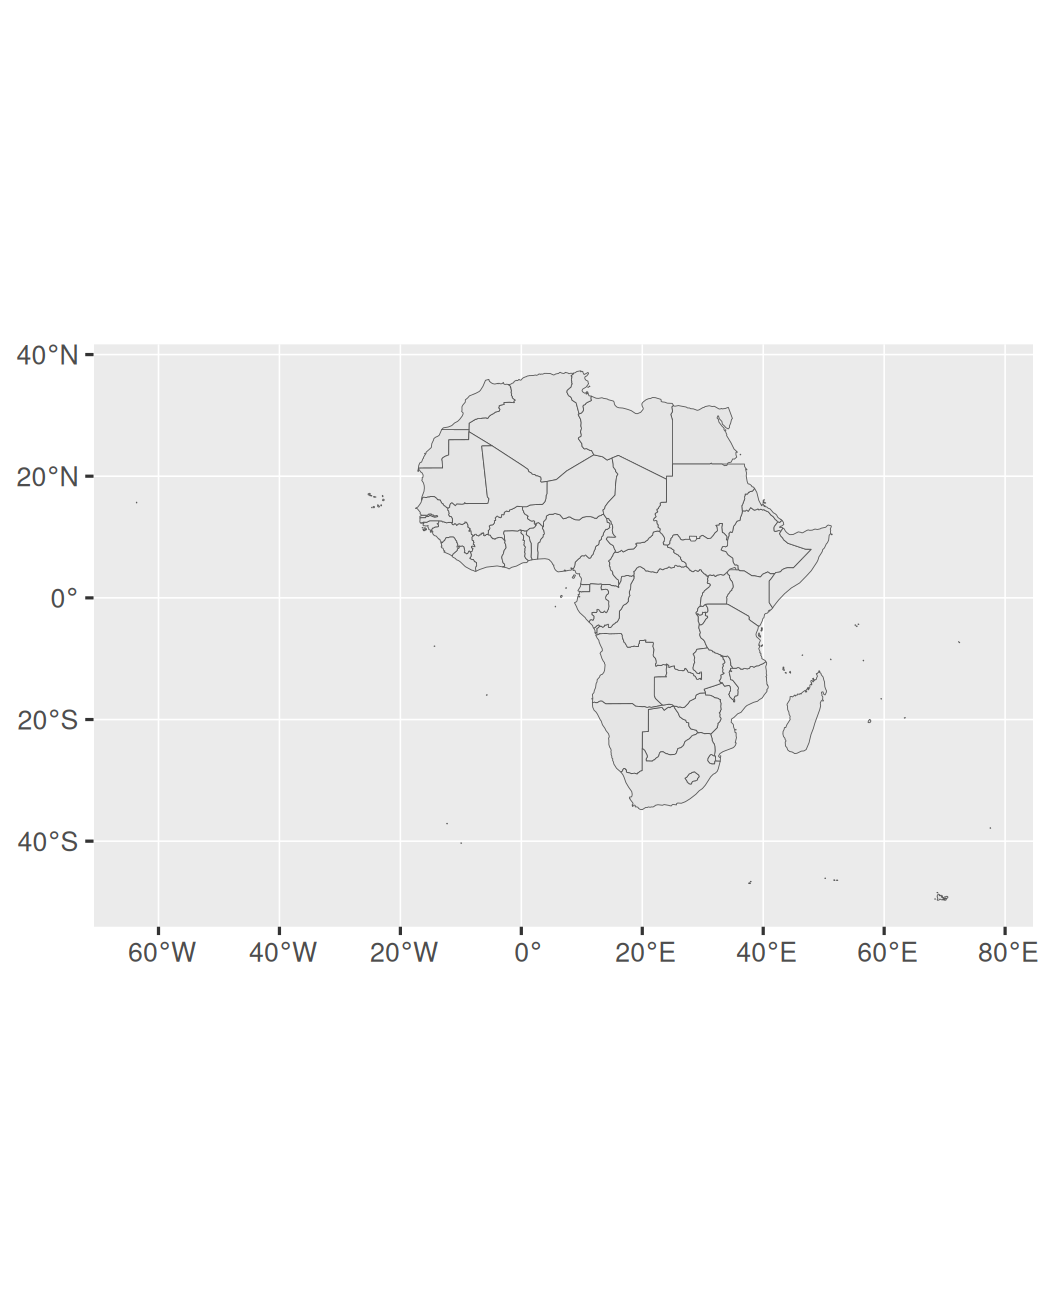
Map Map
< Contents | See Coordinate Reference Systems
africa <- giscoR::gisco_get_countries( region="Africa")ggplot(africa) + geom_sf() + coord_sf(xlim=c(-20, 50), ylim=c(-40, 40))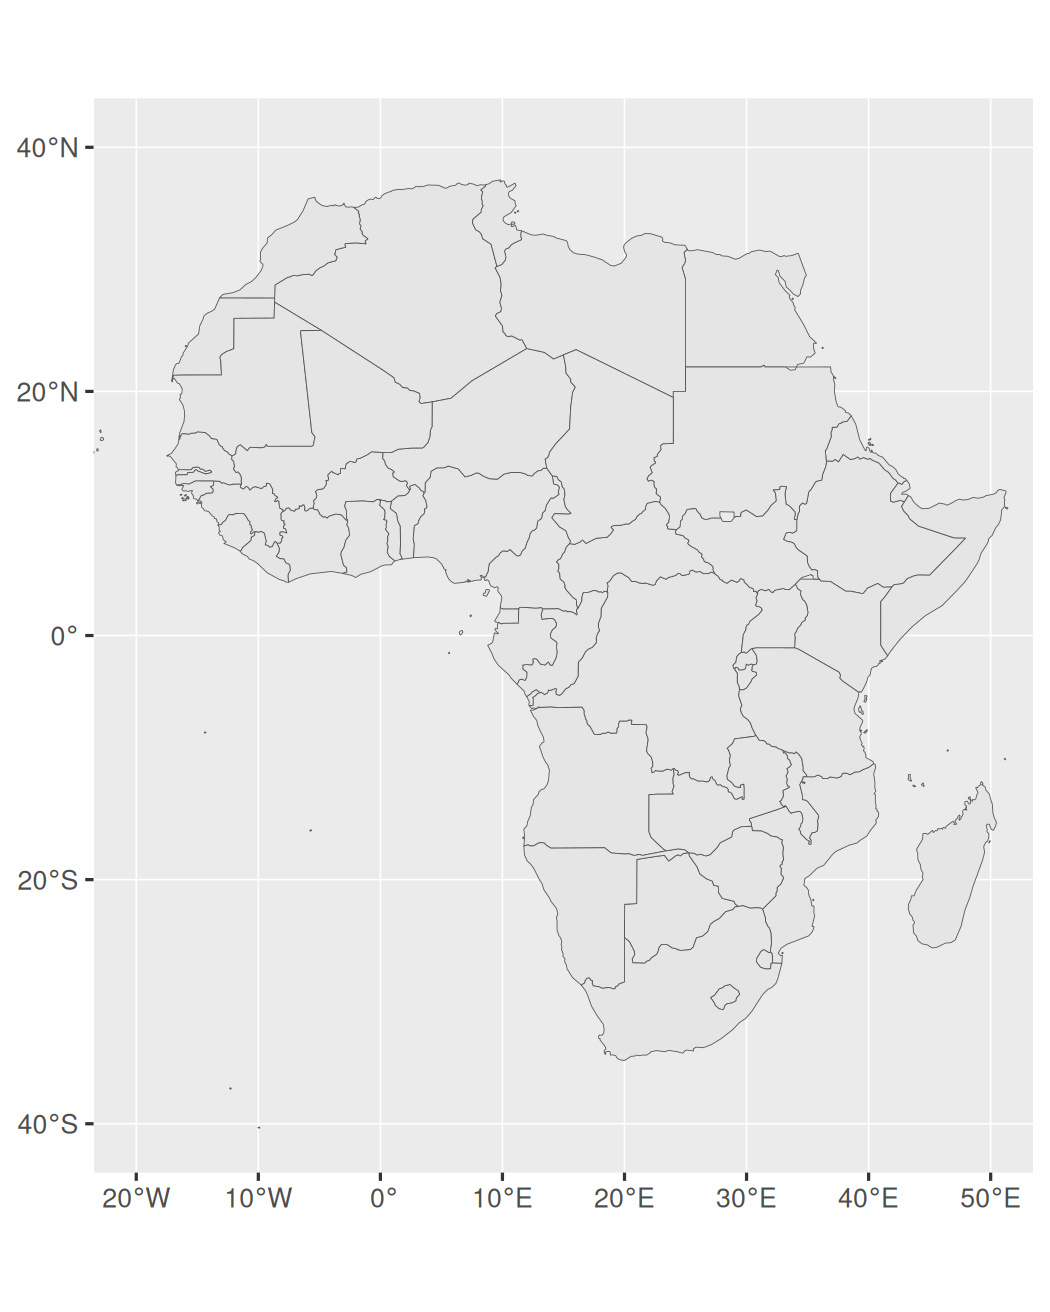
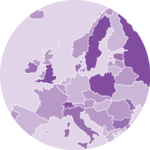
Map Choropleth
africa <- giscoR::gisco_get_countries( region="Africa") |> left_join( africamonitor::am_data( series="SP_POP_TOTL", from=2021, to=2021), by=c("ISO3_CODE"="ISO3"))ggplot(africa) + geom_sf(aes(fill=SP_POP_TOTL)) + coord_sf(xlim=c(-20, 50), ylim=c(-40, 40)) + scale_fill_viridis_c() + labs(fill="Population") + theme(legend.position=c(0, 0), legend.justification=c(0, 0))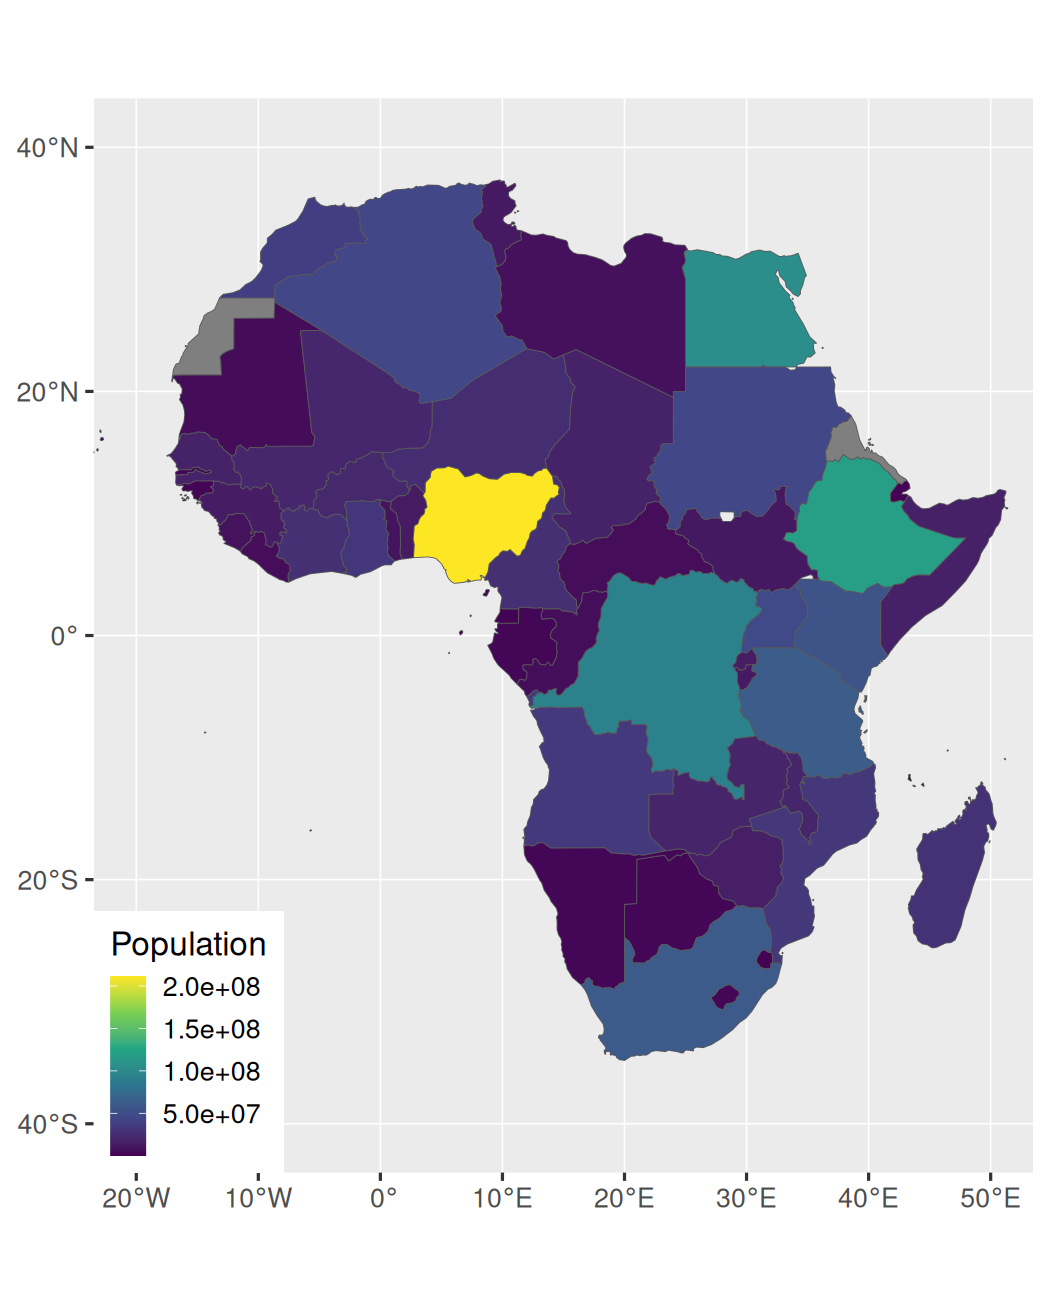
Map Cartogram
africa <- giscoR::gisco_get_countries( region="Africa") |> left_join( africamonitor::am_data( series="SP_POP_TOTL", from=2021, to=2021), by=c("ISO3_CODE"="ISO3")) |> sf::st_transform(3857) |> cartogram::cartogram_cont( "SP_POP_TOTL", itermax=5) |> sf::st_transform(4326)ggplot(africa) + geom_sf(aes(fill=SP_POP_TOTL)) + coord_sf(xlim=c(-20, 50), ylim=c(-40, 40)) + scale_fill_viridis_c() + labs(fill="Population") + theme(legend.position=c(0, 0), legend.justification=c(0, 0))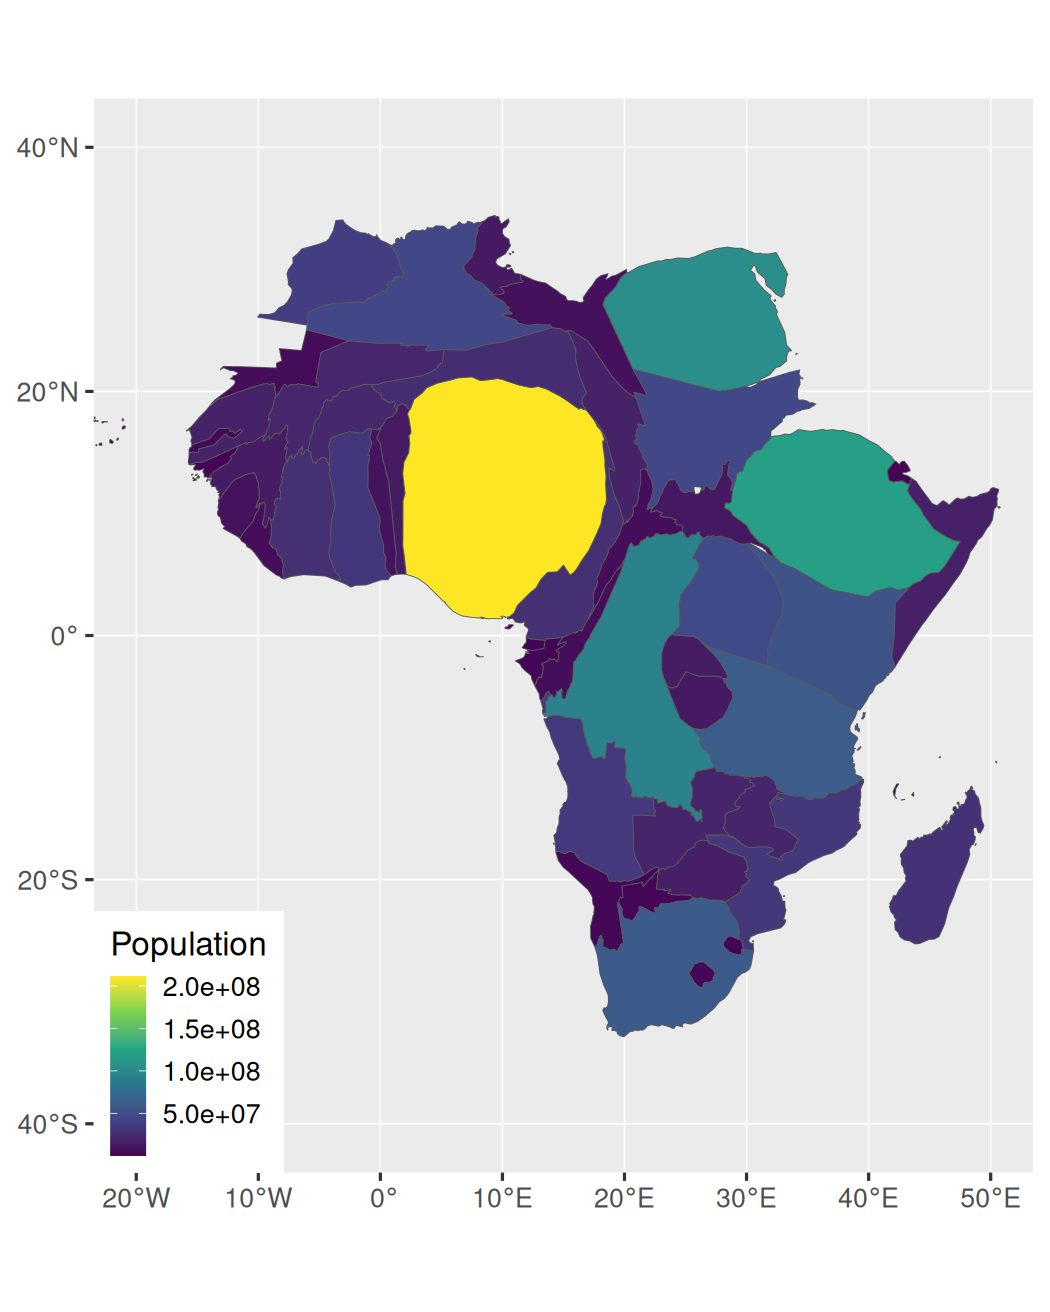
Map Bubble map
africa <- giscoR::gisco_get_countries( region="Africa") |> left_join( africamonitor::am_data( series="SP_POP_TOTL", from=2021, to=2021), by=c("ISO3_CODE"="ISO3"))centroids <- africa |> sf::st_centroid()ggplot(centroids) + geom_sf(data=africa) + geom_sf(aes(size=SP_POP_TOTL)) + coord_sf(xlim=c(-20, 50), ylim=c(-40, 40)) + labs(size="Population") + theme(legend.position=c(0, 0), legend.justification=c(0, 0))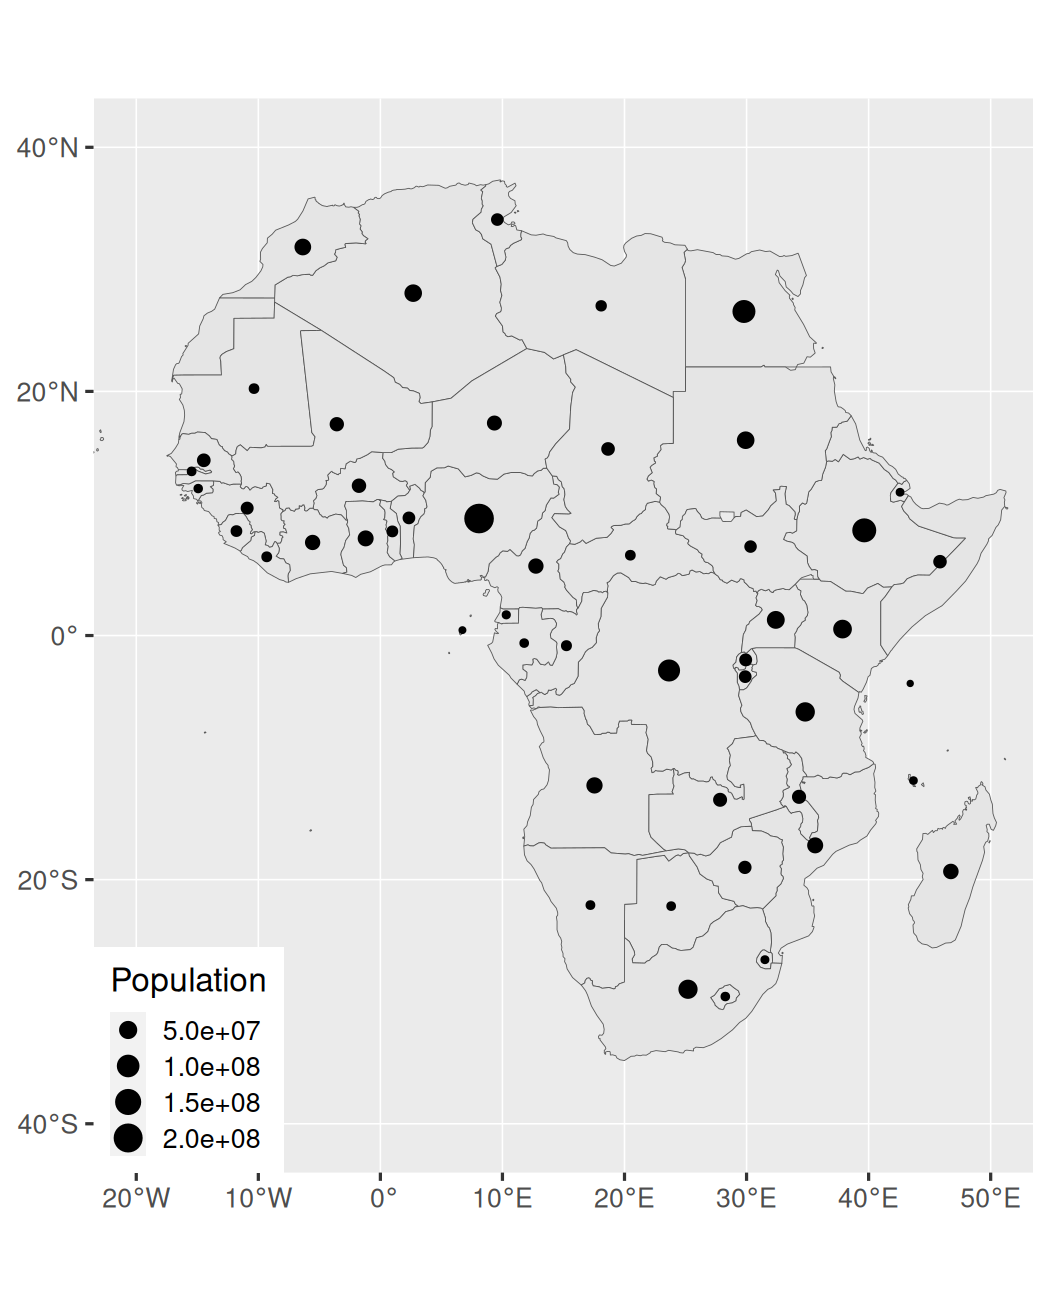
Map Connection
africa <- giscoR::gisco_get_countries( region="Africa") |> left_join( africamonitor::am_data( series="SP_POP_TOTL", from=2021, to=2021), by=c("ISO3_CODE"="ISO3"))centroids <- africa |> sf::st_centroid()lines <- centroids |> sf::st_union() |> sf::st_cast("LINESTRING")ggplot(lines) + geom_sf(data=africa) + geom_sf(aes(size=SP_POP_TOTL), data=centroids) + geom_sf() + coord_sf(xlim=c(-20, 50), ylim=c(-40, 40)) + labs(size="Population") + theme(legend.position=c(0, 0), legend.justification=c(0, 0))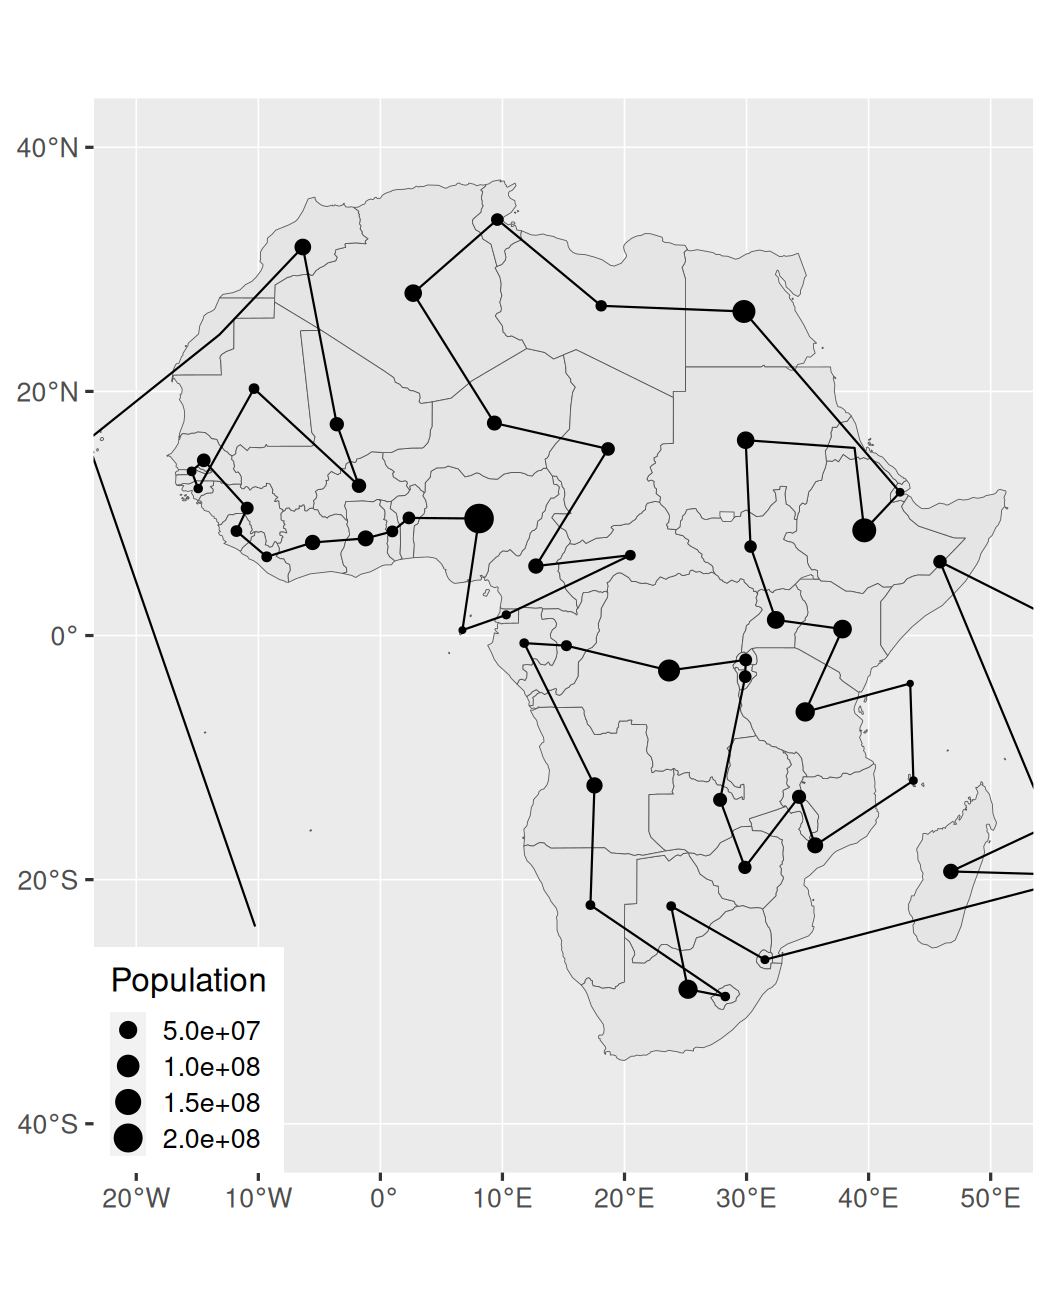
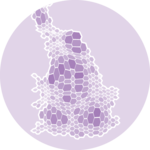
Map Hexbin map
esp <- mapSpain::esp_get_country()hexccaa <- mapSpain::esp_get_hex_ccaa()ggplot(hexccaa) + geom_sf(data=esp) + geom_sf(aes(fill=codauto), alpha=0.3, show.legend=FALSE) + geom_sf_text( aes(label=label), check_overlap=TRUE) + theme_void(base_size=16)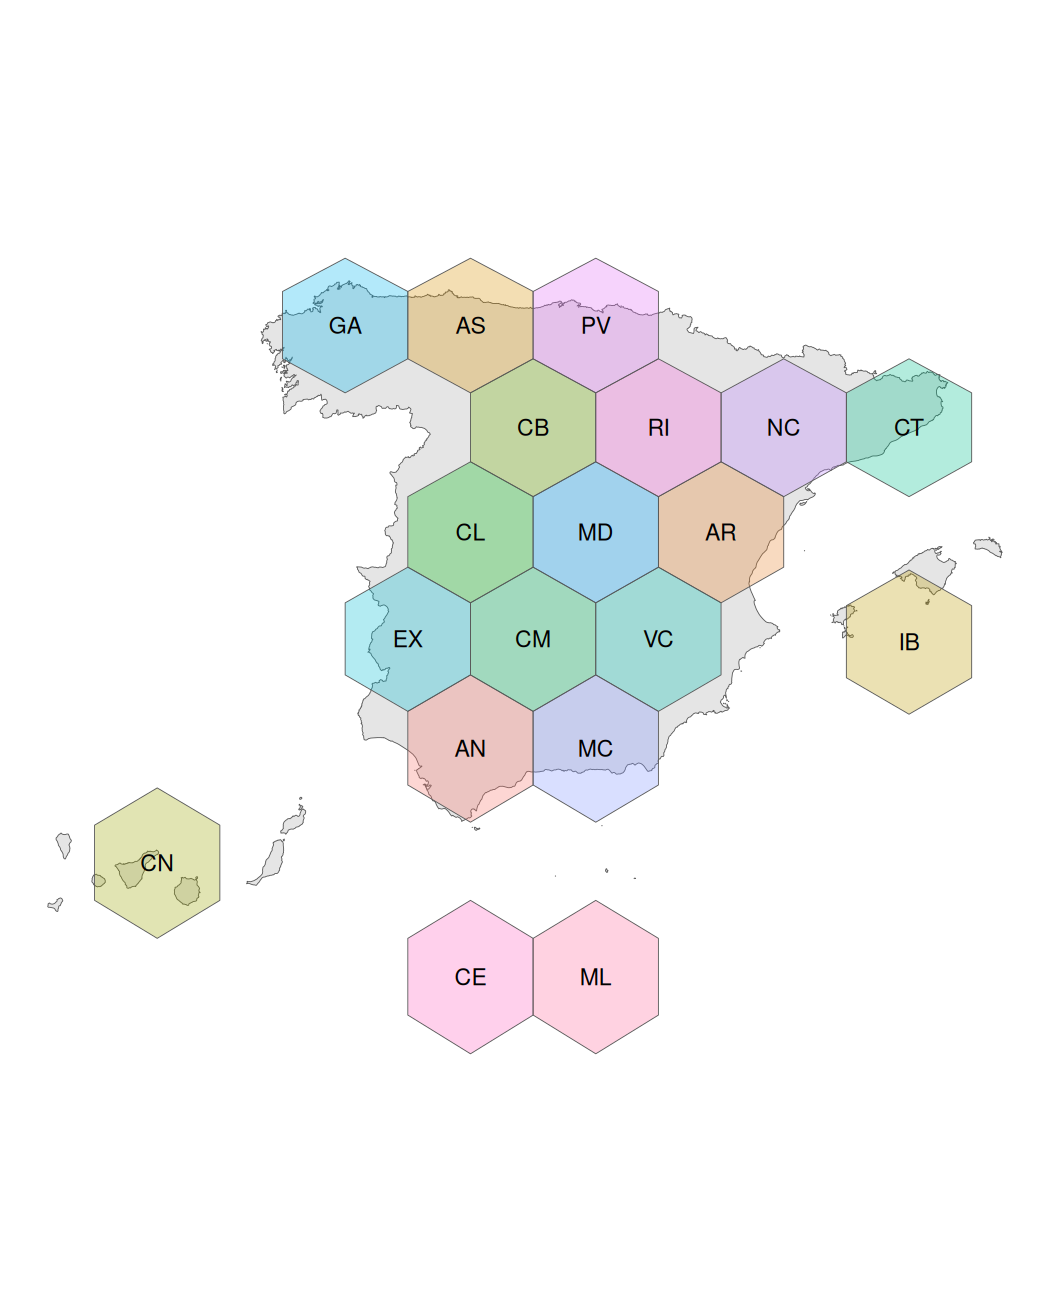
Map Hexbin map
esp <- mapSpain::esp_get_country()hexprov <- mapSpain::esp_get_hex_prov()ggplot(hexprov) + geom_sf(data=esp) + geom_sf(aes(fill=codauto), alpha=0.3, show.legend=FALSE) + geom_sf_text( aes(label=label), check_overlap=TRUE) + theme_void(base_size=16)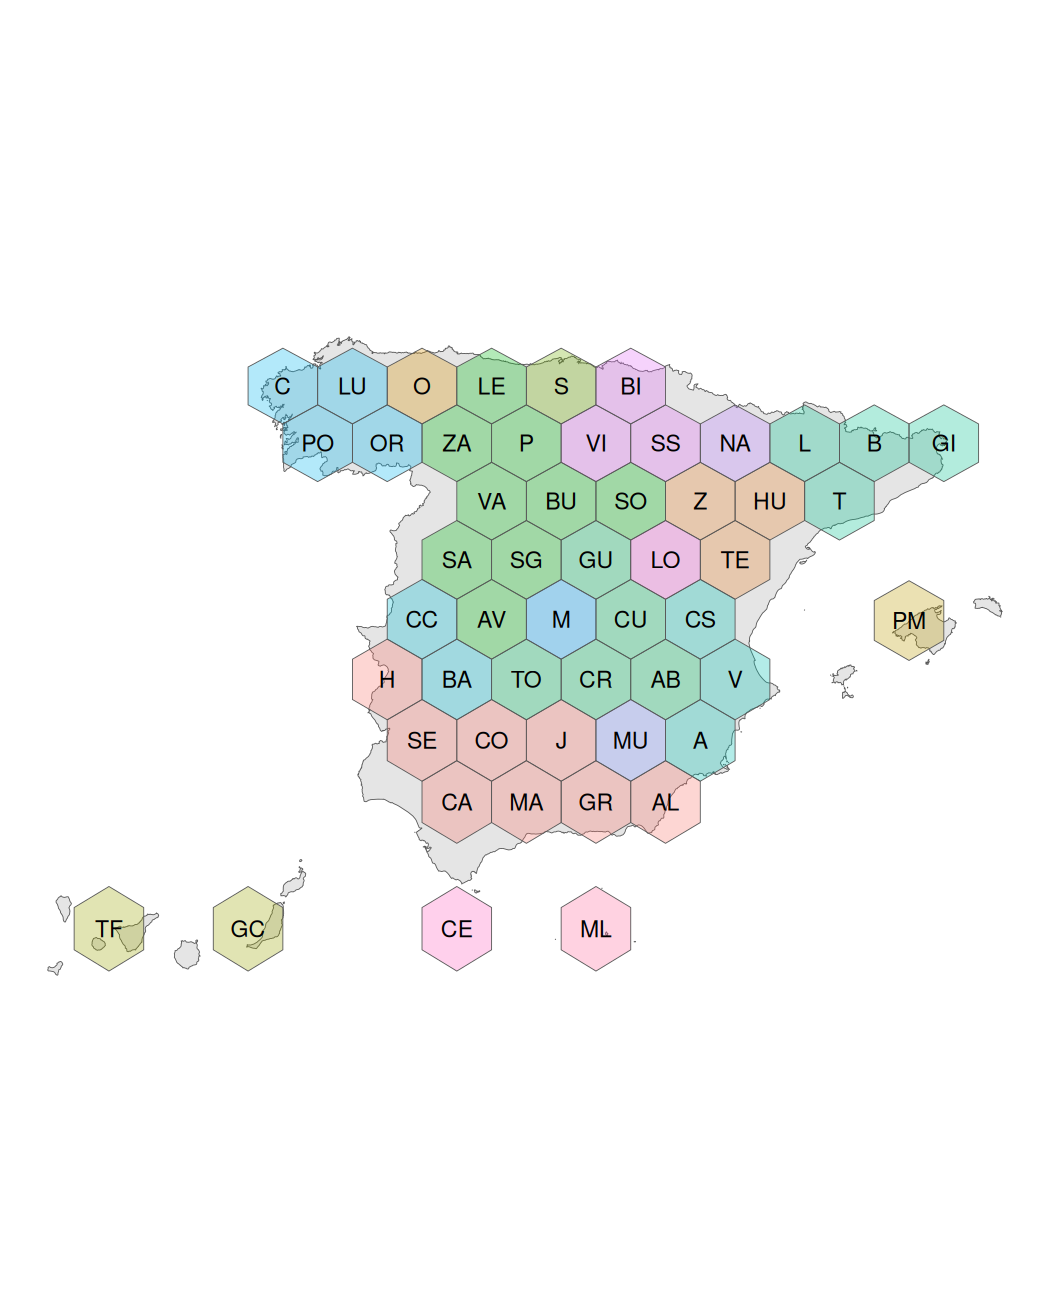
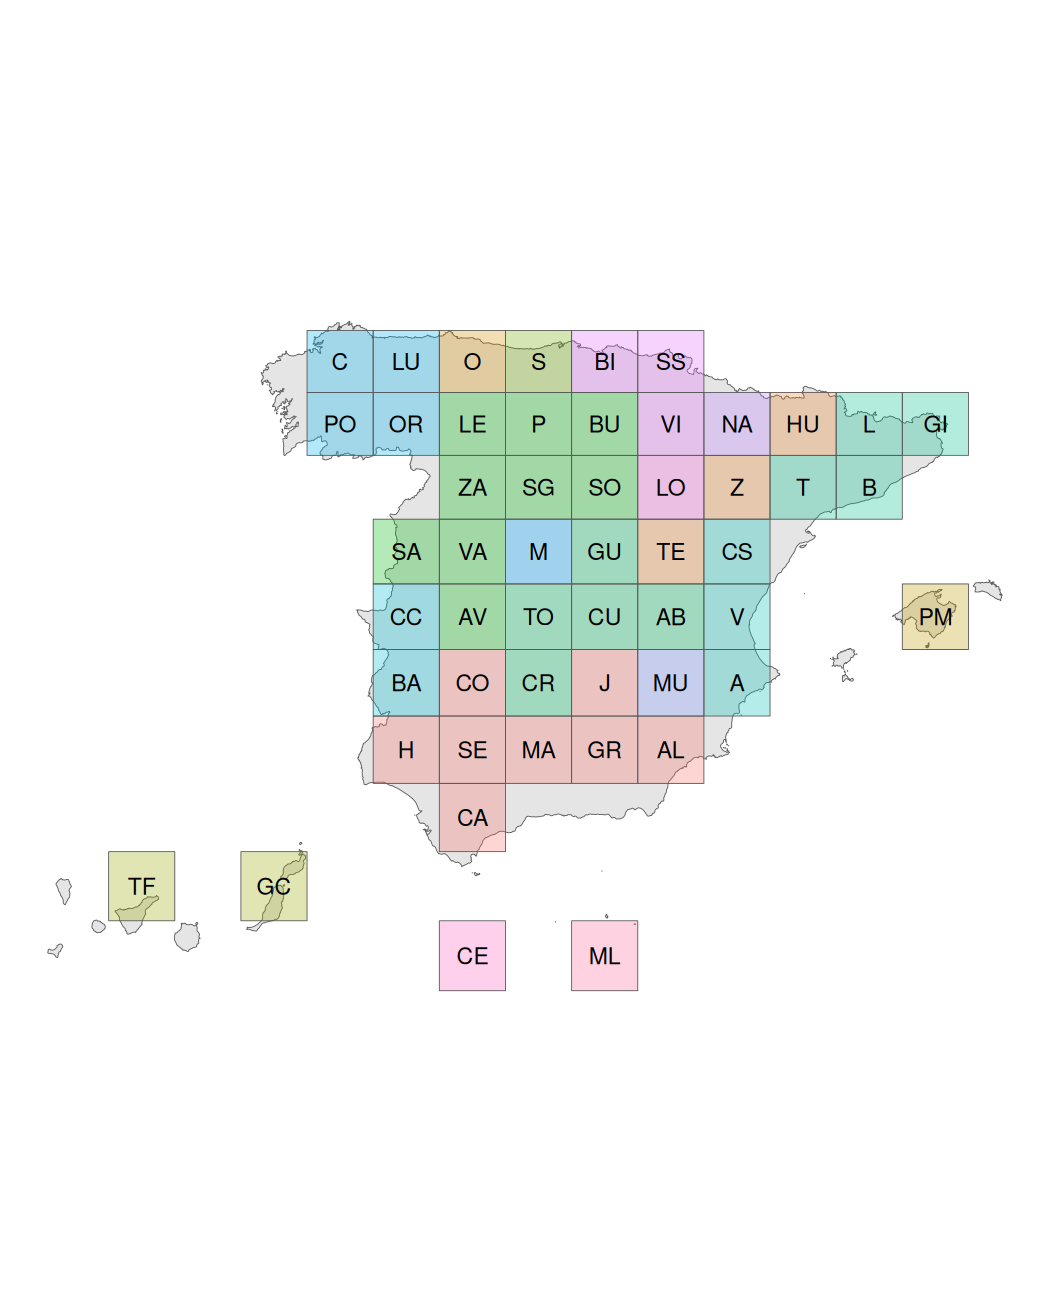
Map Hexbin map
esp <- mapSpain::esp_get_country()gridprov <- mapSpain::esp_get_grid_prov()ggplot(gridprov) + geom_sf(data=esp) + geom_sf(aes(fill=codauto), alpha=0.3, show.legend=FALSE) + geom_sf_text( aes(label=label), check_overlap=TRUE) + theme_void(base_size=16)