Directory of Visualizations
Based on The R Graph Gallery


Evolution


Line plot Area Stacked area Stream chart Time series
- Visualization of the evolution of series
- Individual data points are not important
- When
xis time -> time series
Evolution Line plot
ggstream::blockbusters |> filter(genre == "Action") |>ggplot() + aes(year, box_office) + geom_line()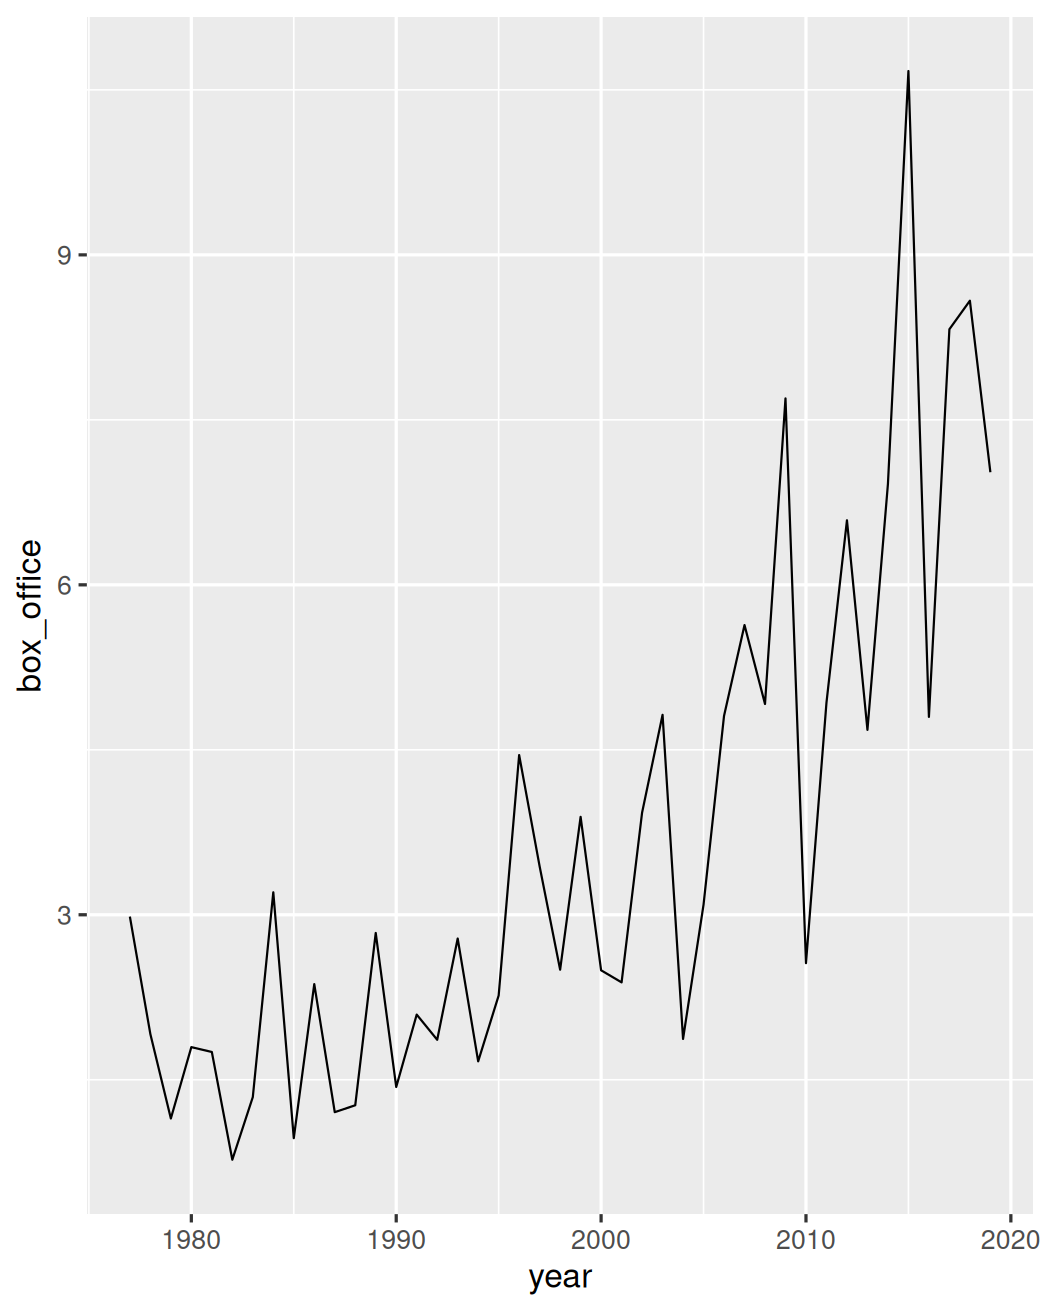
Evolution Area
ggstream::blockbusters |> filter(genre == "Action") |>ggplot() + aes(year, box_office) + geom_area()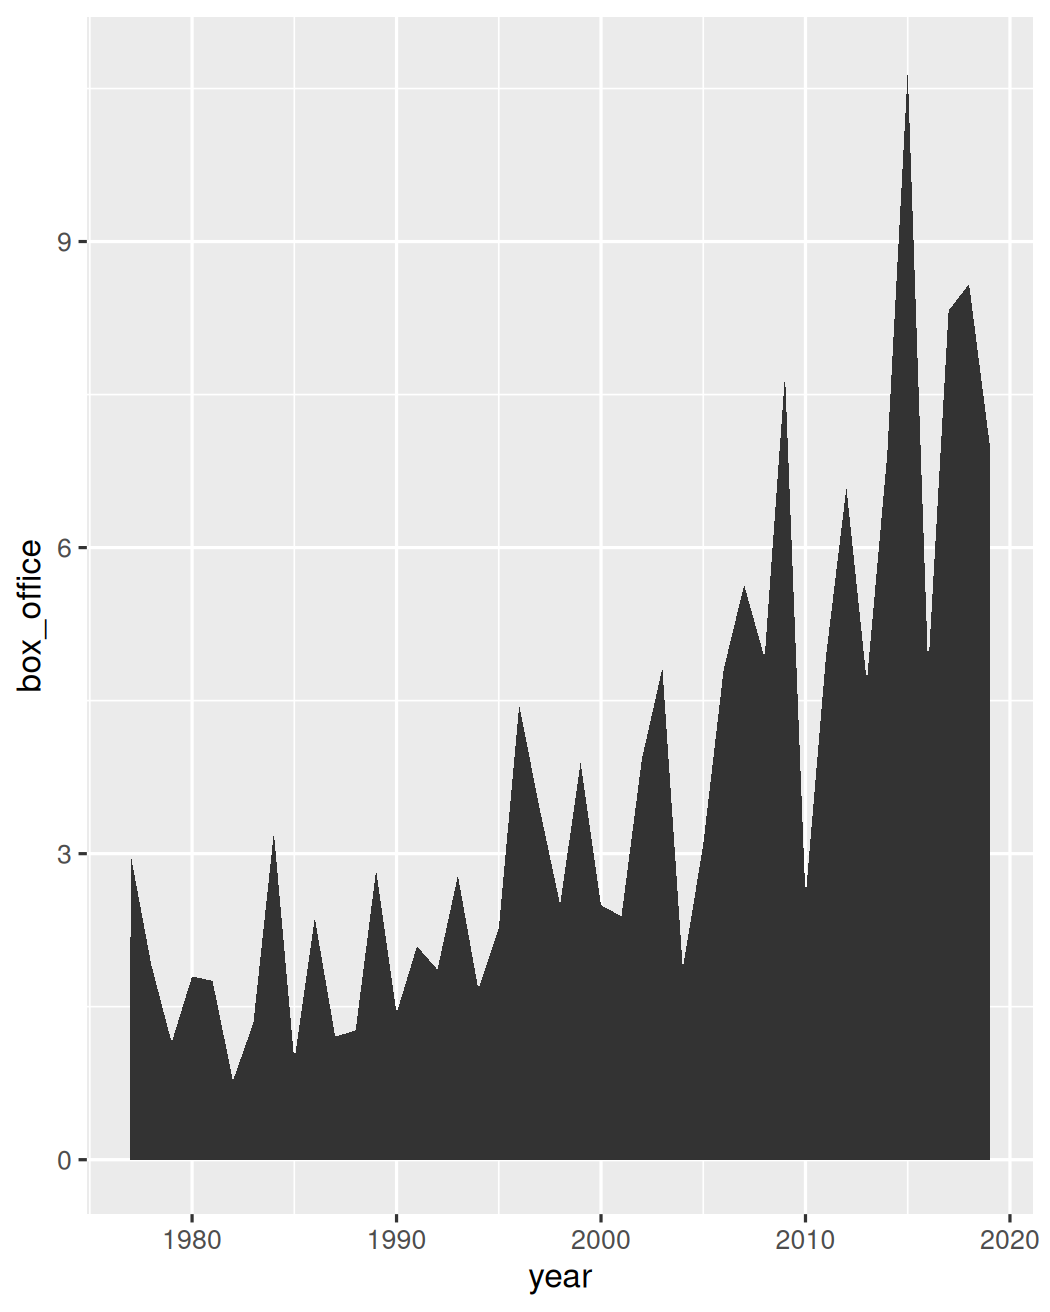
Evolution Time series
ggstream::blockbusters |> mutate(date = as.Date( ISOdate(year, 1, 1))) |> filter(genre == "Action") |>ggplot() + aes(date, box_office) + geom_line()
Evolution Time series
ggstream::blockbusters |> mutate(date = as.Date( ISOdate(year, 1, 1))) |>ggplot() + aes(date, box_office) + geom_line(aes(color=genre))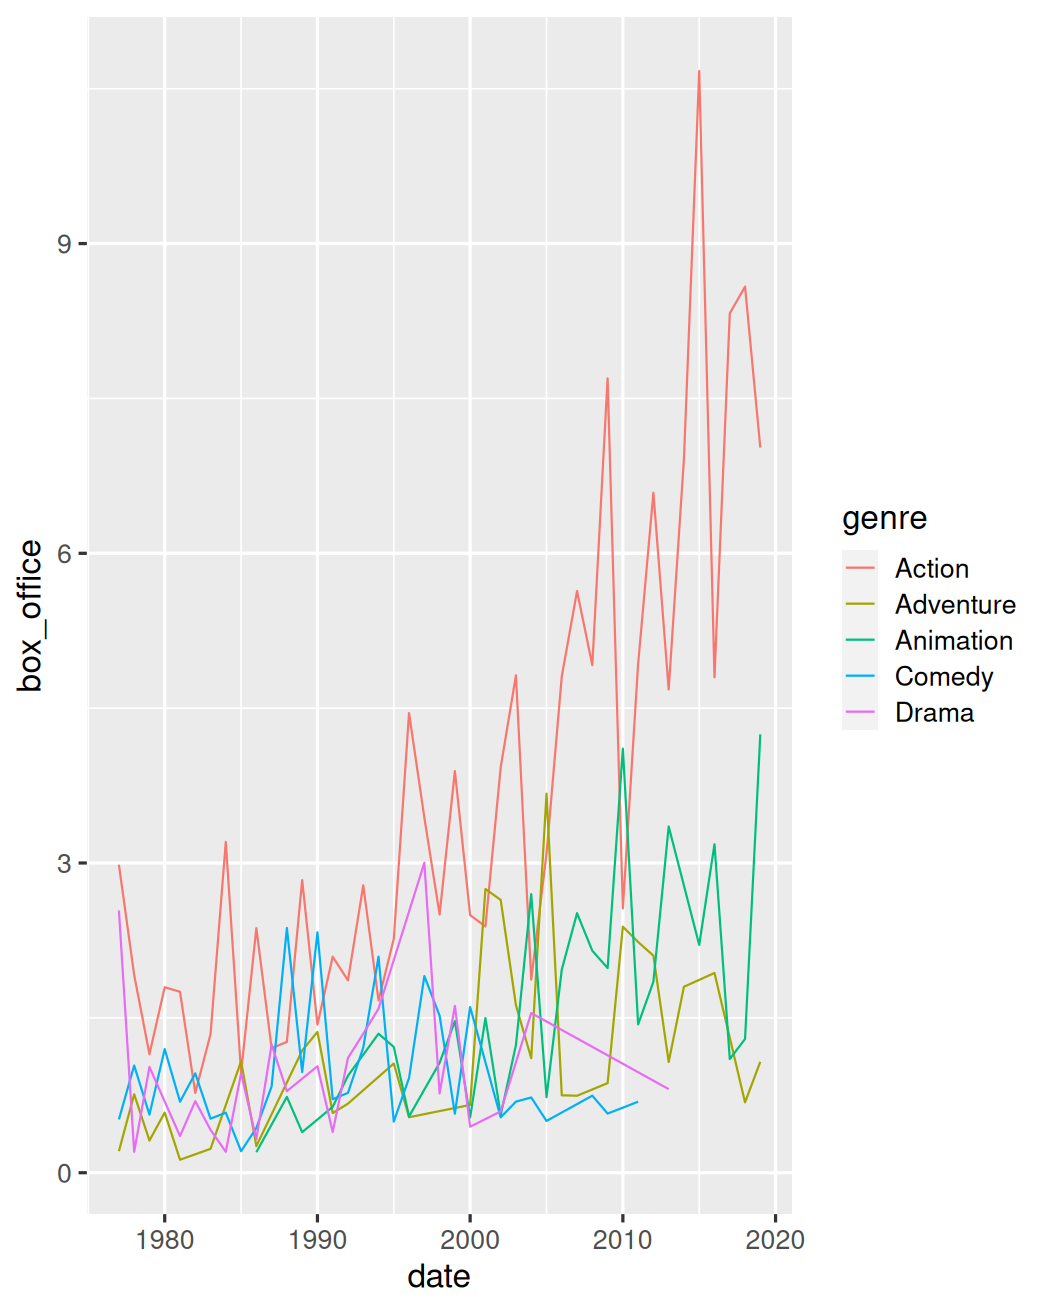
Evolution Time series
ggstream::blockbusters |> mutate(date = as.Date( ISOdate(year, 1, 1))) |> mutate(genre = forcats::fct_reorder2( genre, year, box_office)) |>ggplot() + aes(date, box_office) + geom_line(aes(color=genre))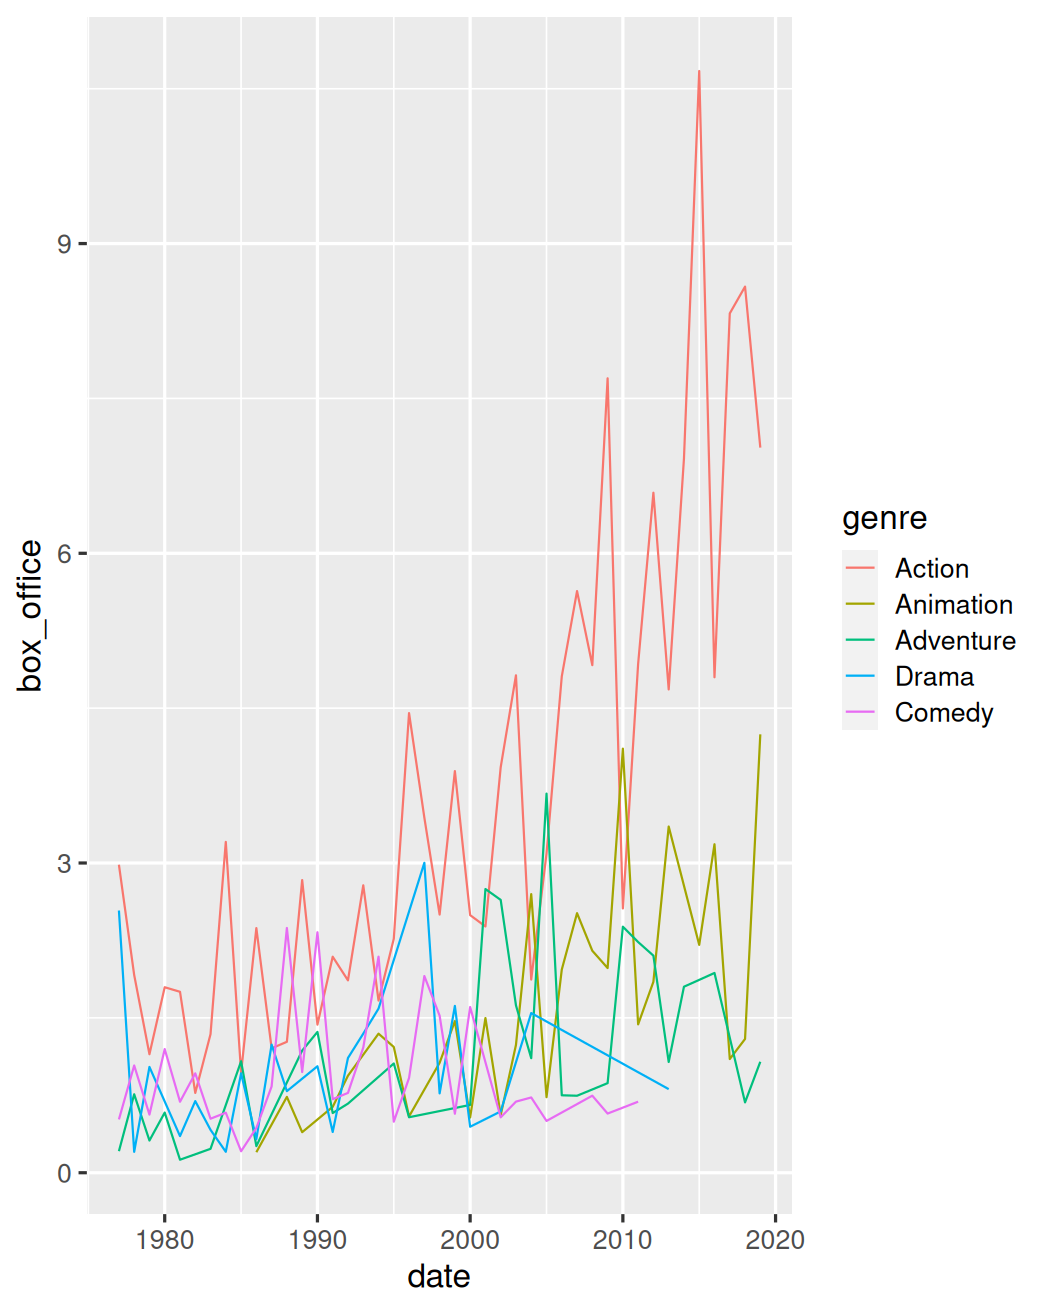
Evolution Time series
df <- ggstream::blockbusters |> mutate(date = as.Date( ISOdate(year, 1, 1)))text <- df |> group_by(genre) |> slice(n())ggplot(df) + aes(date, box_office, color=genre) + geom_line() + geom_text(aes(label=genre), text, hjust=-0.1) + expand_limits( x=as.Date("2024-01-01")) + theme(legend.position="none")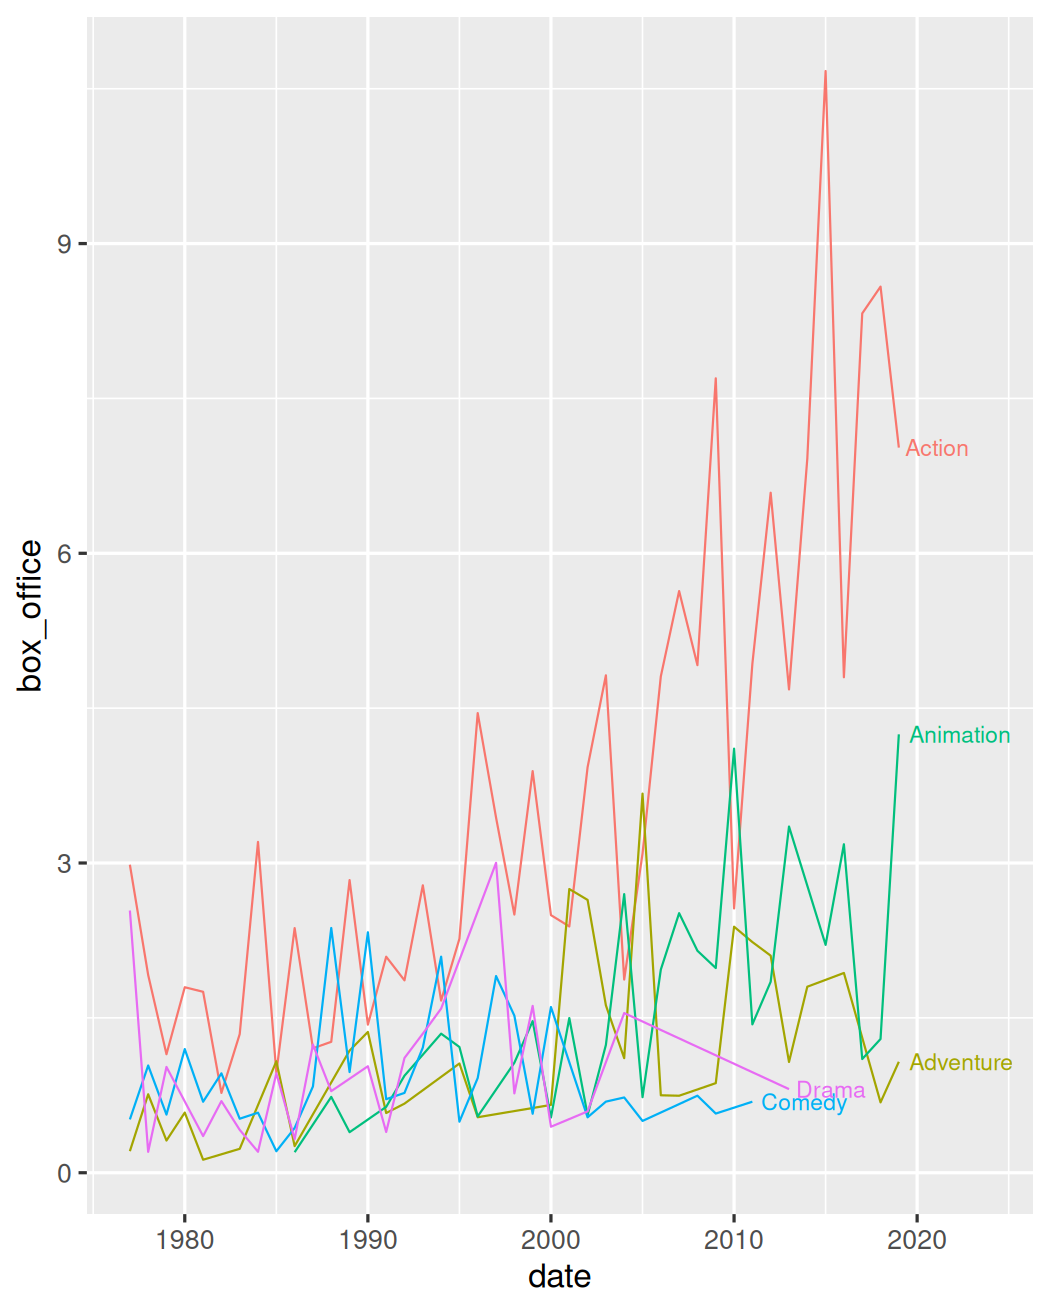
Evolution Stacked area
ggstream::blockbusters |> mutate(date = as.Date( ISOdate(year, 1, 1))) |>ggplot() + aes(date, box_office) + geom_area(aes(fill=genre))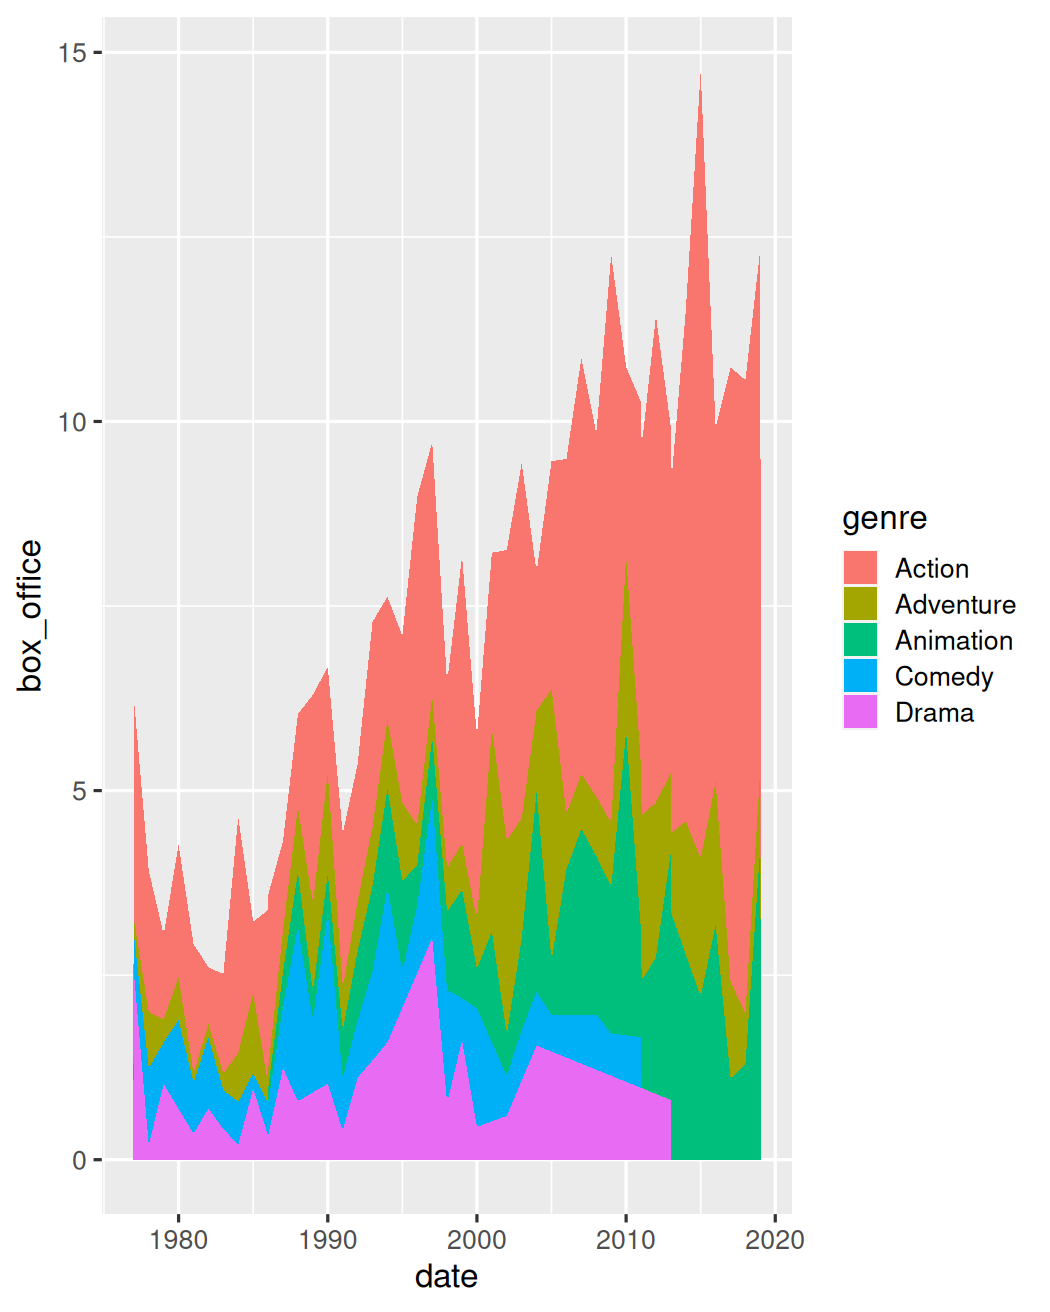
Evolution Streamchart
ggstream::blockbusters |> mutate(date = as.Date( ISOdate(year, 1, 1))) |>ggplot() + aes(date, box_office) + ggstream::geom_stream( aes(fill=genre), type="ridge")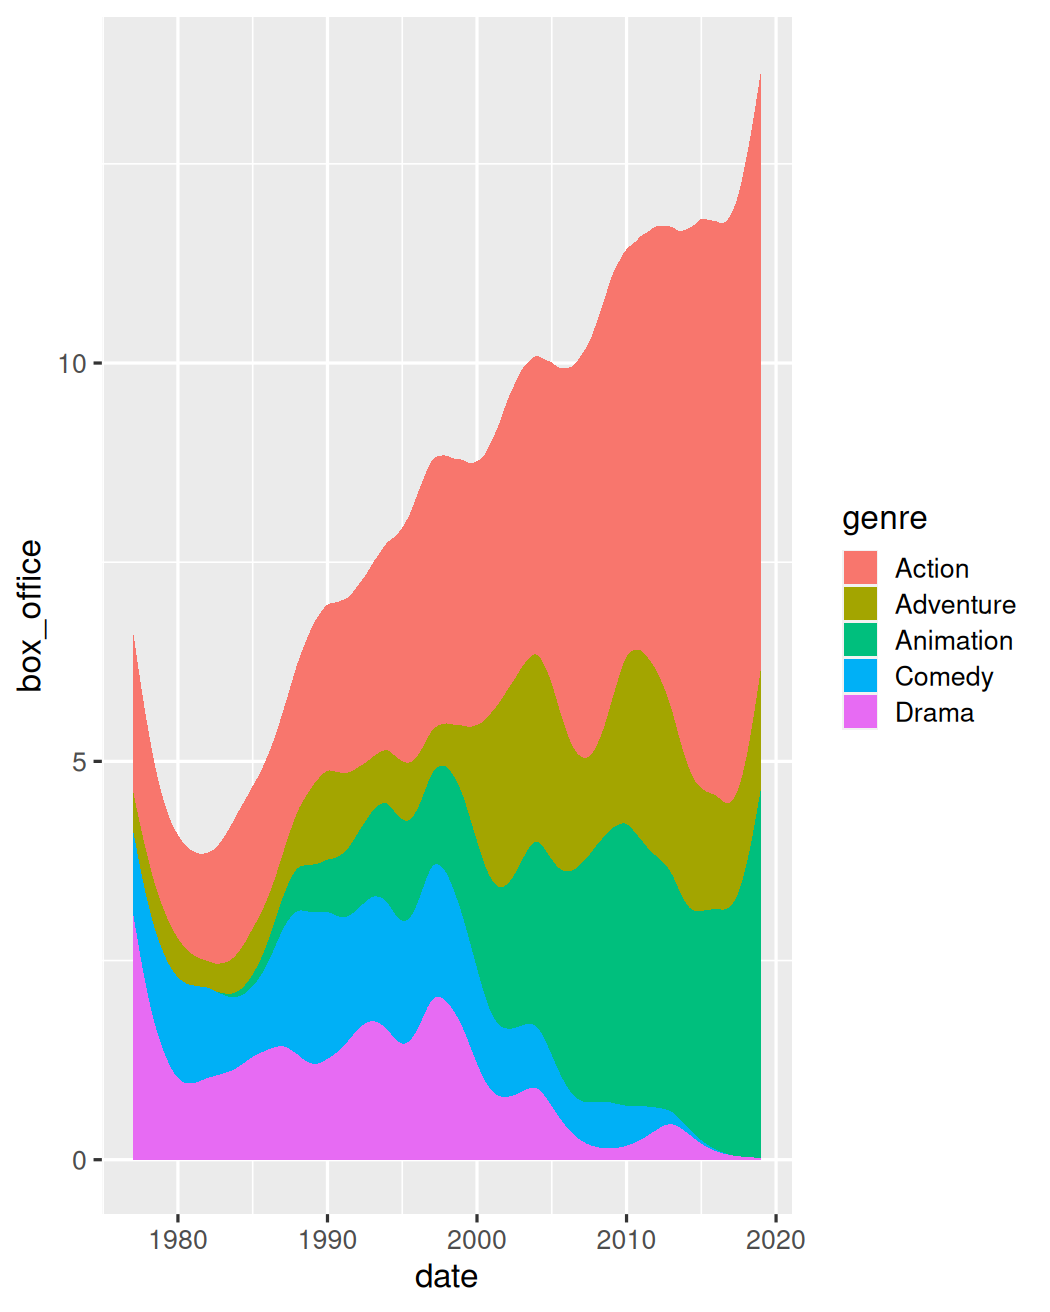
Evolution Streamchart
ggstream::blockbusters |> mutate(date = as.Date( ISOdate(year, 1, 1))) |>ggplot() + aes(date, box_office) + ggstream::geom_stream( aes(fill=genre), type="mirror")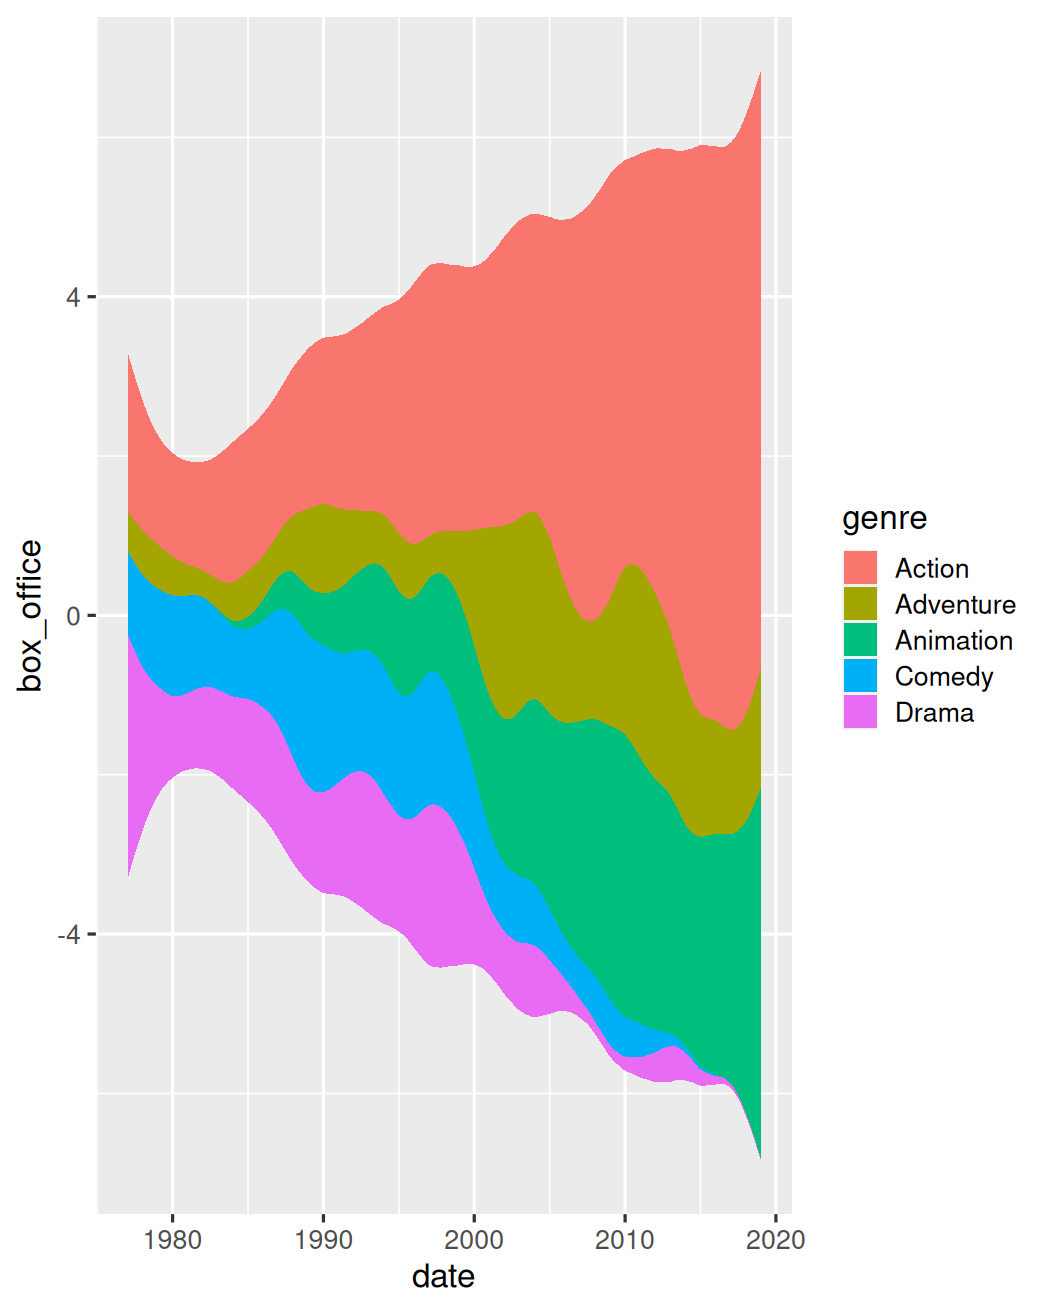
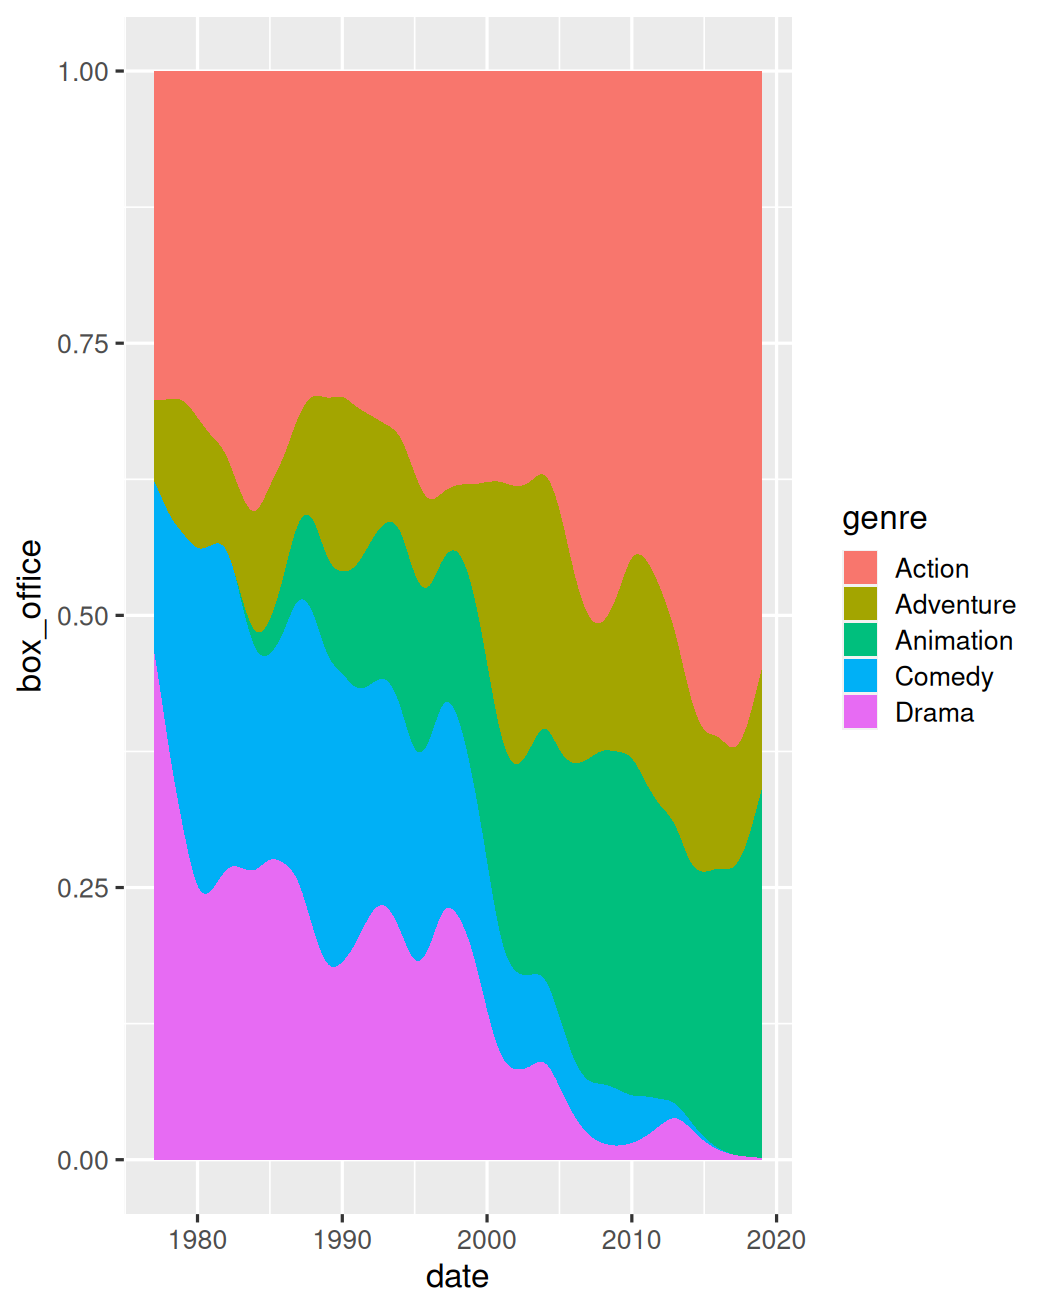
Evolution Streamchart
ggstream::blockbusters |> mutate(date = as.Date( ISOdate(year, 1, 1))) |>ggplot() + aes(date, box_office) + ggstream::geom_stream( aes(fill=genre), type="proportional")