Directory of Visualizations
Based on The R Graph Gallery


Ranking


Barplot Spider/radar Wordcloud Parallel Lollipop Circular barplot
- Visualization of the ranking of a categorical variable
- Based on some other numerical variable
- Sort your data!
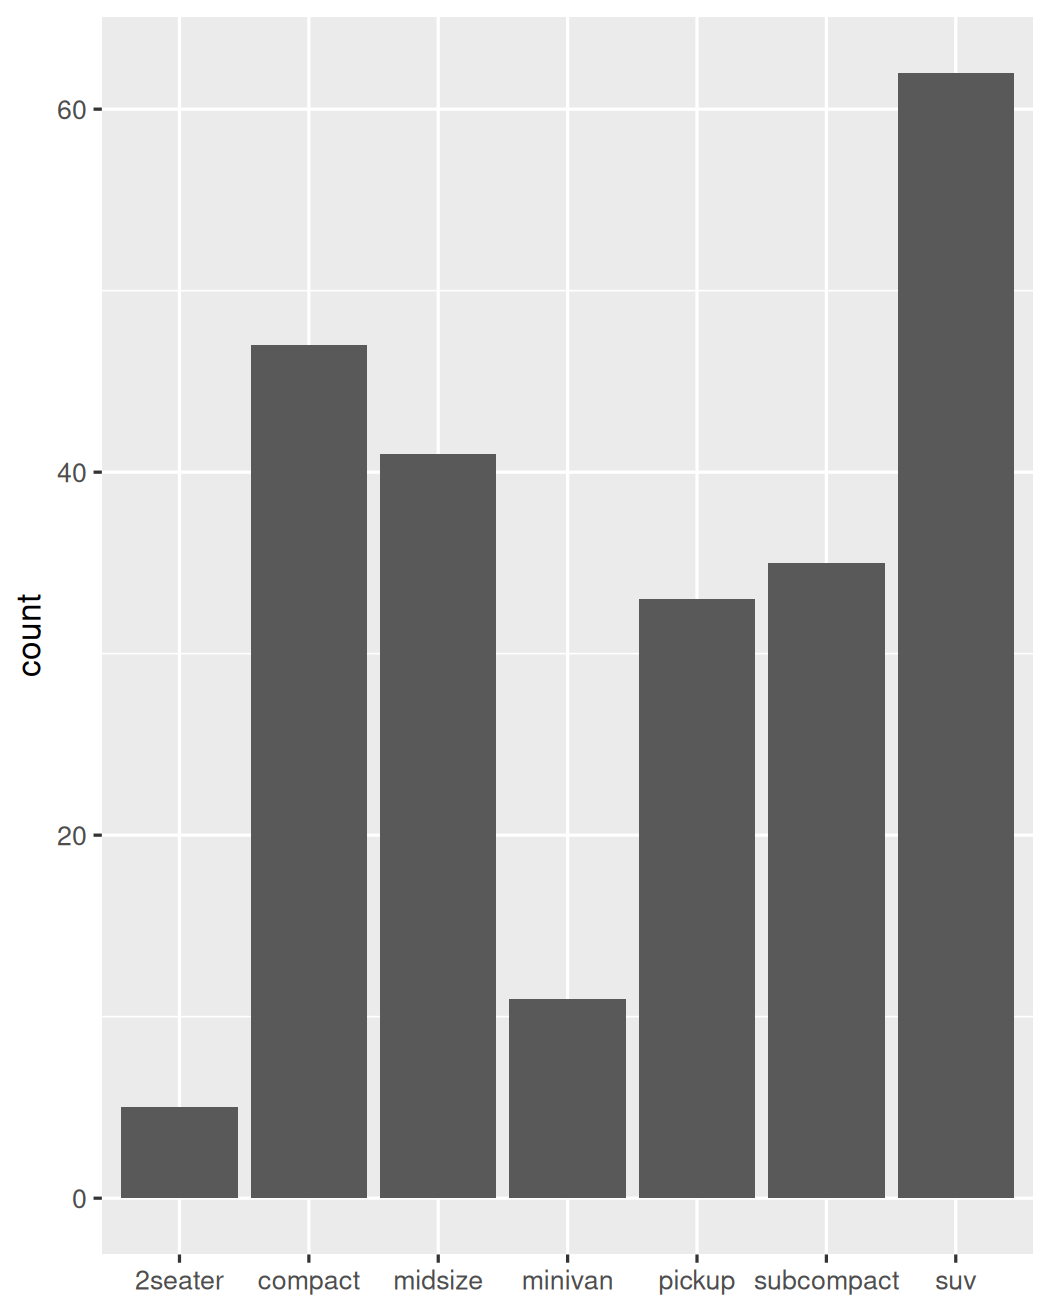
Ranking Barplot
mpg |> count(drv, class, name="count") |>ggplot() + aes(count, class) + geom_col() + labs(y=NULL)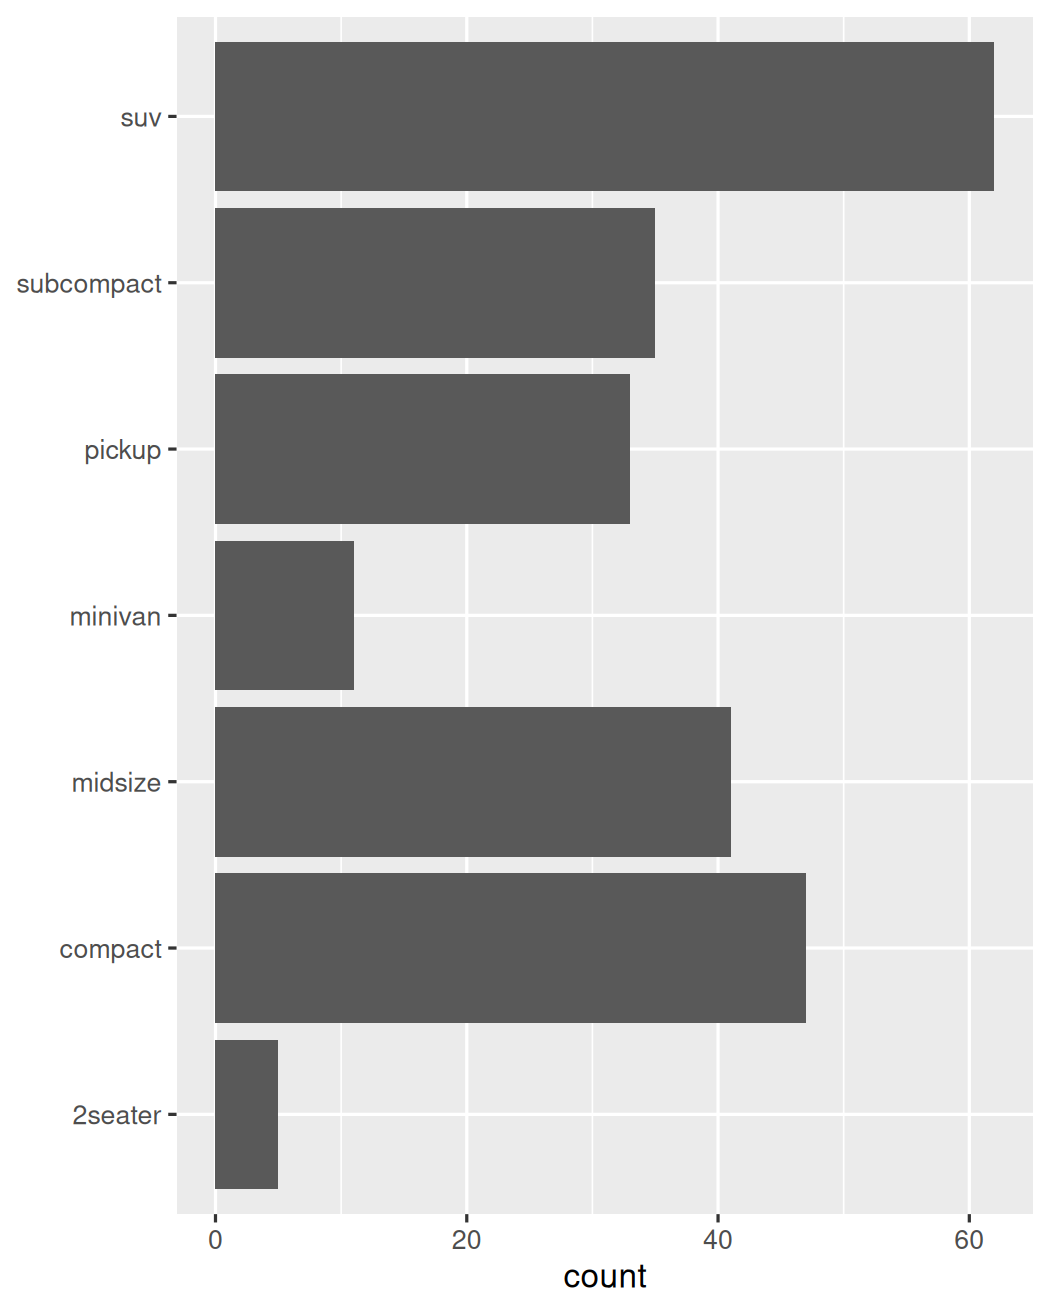
Ranking Barplot
mpg |> count(drv, class, name="count") |>ggplot() + aes(count, reorder(class, count, sum)) + geom_col() + labs(y=NULL)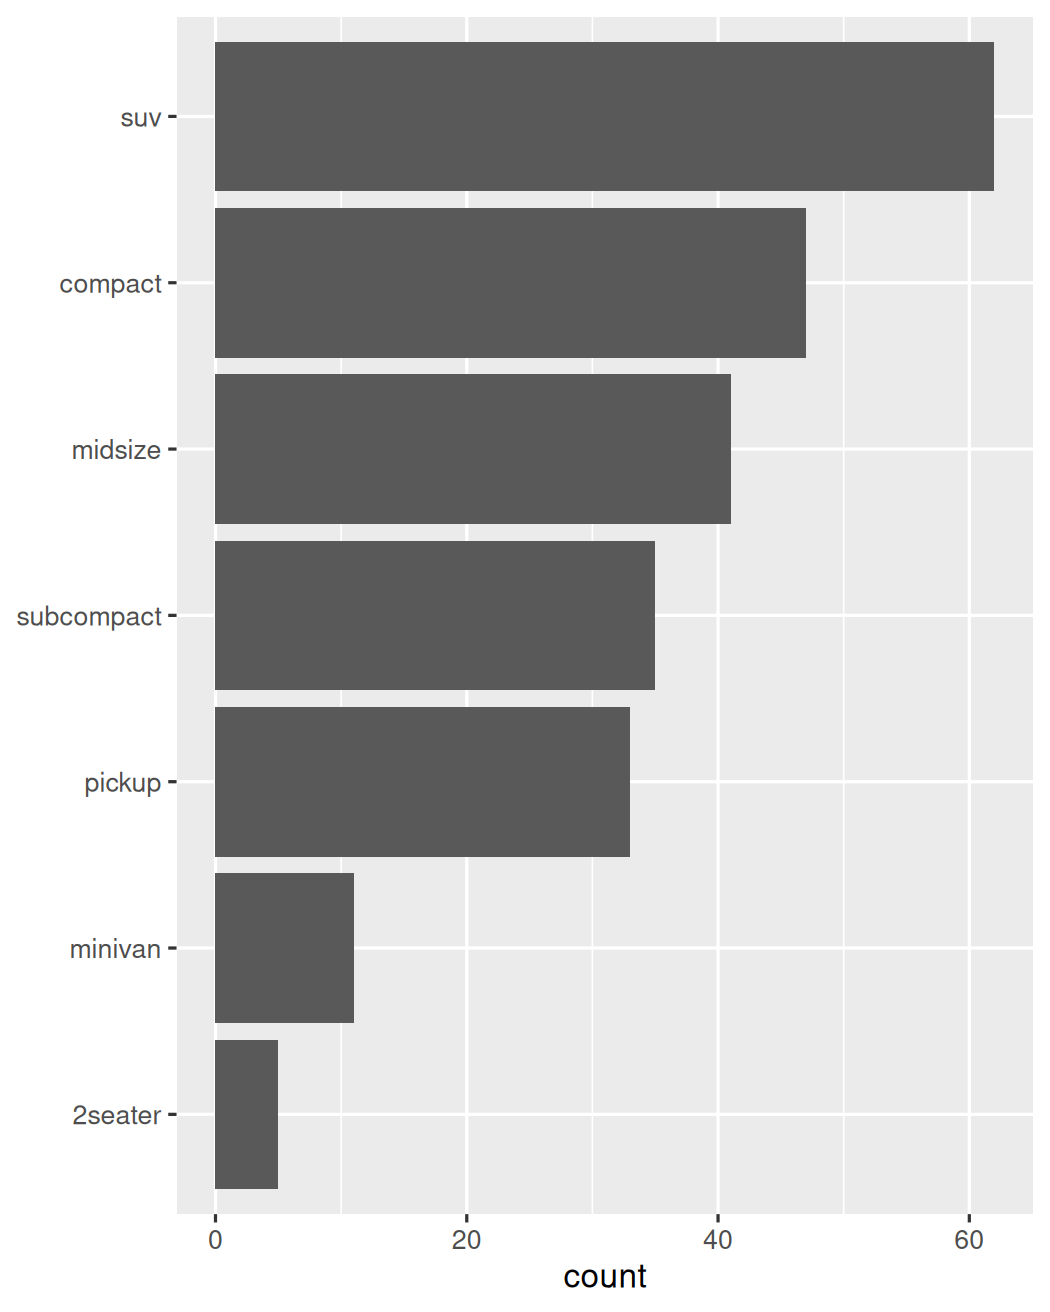
Ranking Barplot
mpg |> count(drv, class, name="count") |>ggplot() + aes(count, reorder(class, count, sum)) + geom_col(aes(fill=drv)) + labs(y=NULL) + theme(legend.position="top")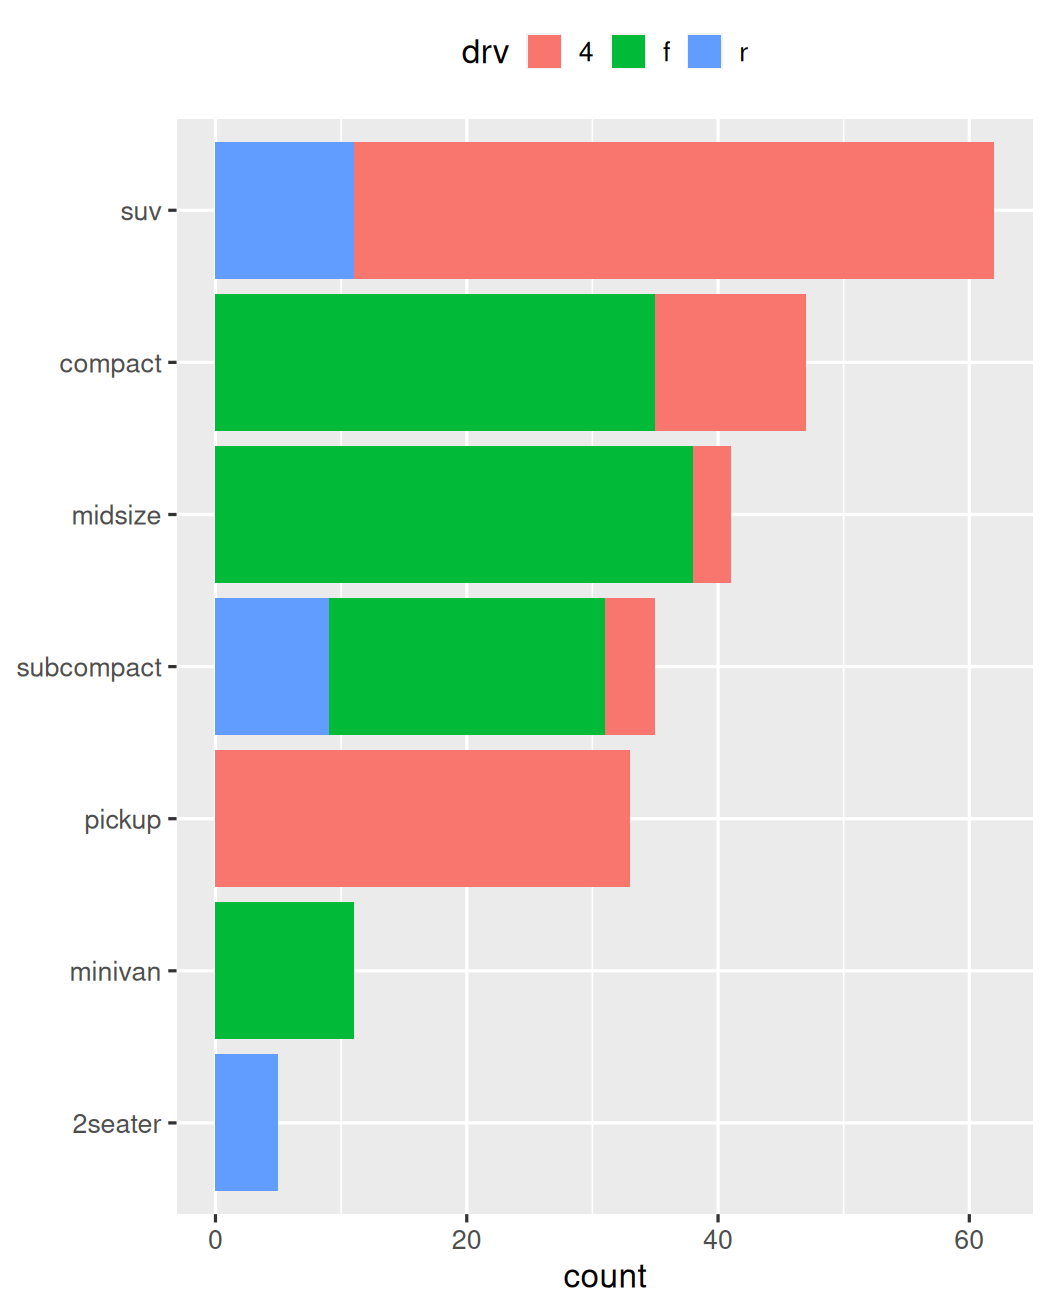
Ranking Circular Barplot
mpg |> count(drv, class, name="count") |>ggplot() + aes(count, reorder(class, count, sum)) + geom_col(aes(fill=drv)) + coord_polar(theta="y") + labs(y=NULL) + theme(legend.position="top")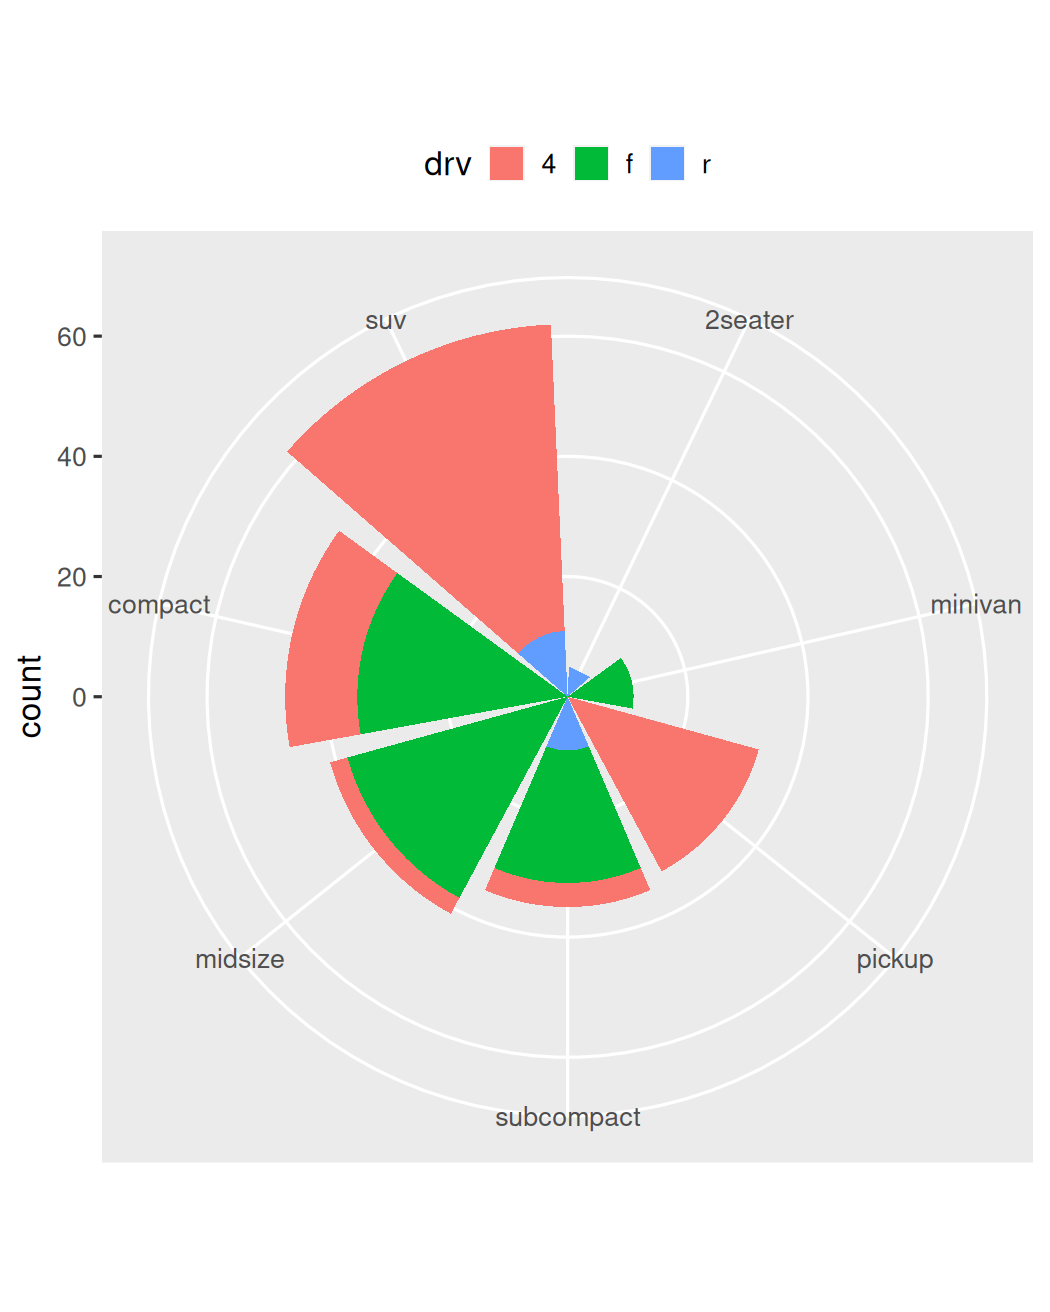
Ranking Lollipop
mpg |> count(drv, class, name="count") |>ggplot() + aes(count, reorder(class, count, sum)) + geom_segment(aes(xend=0, yend=class)) + geom_point(size=3) + labs(y=NULL)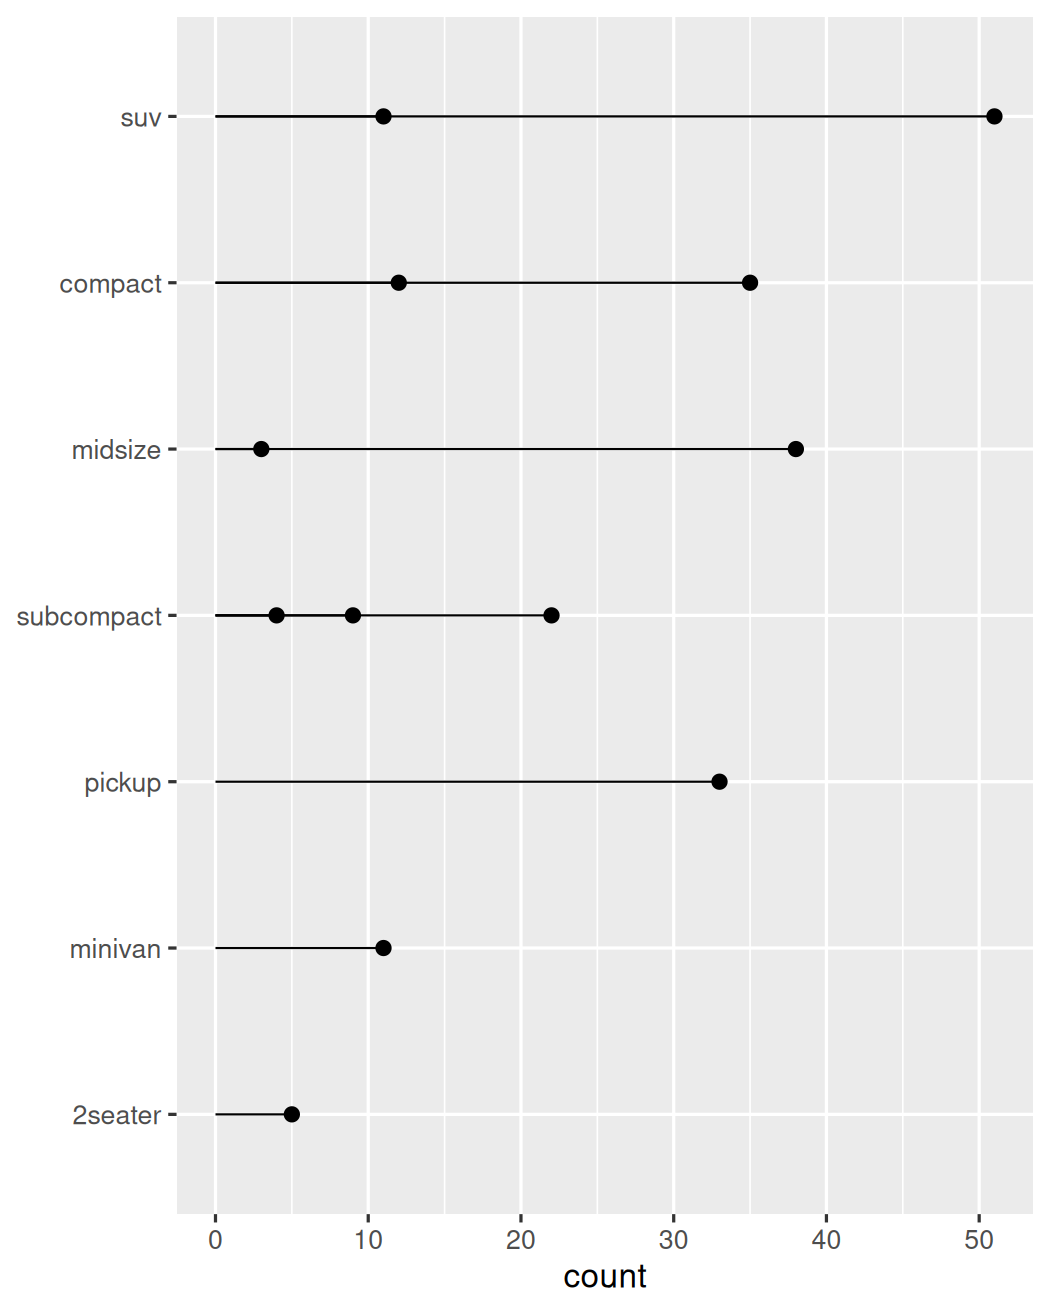
Ranking Lollipop
mpg |> count(drv, class, name="count") |>ggplot() + aes(count, reorder(class, count, sum)) + aes(color=drv) + geom_segment(aes(xend=0, yend=class)) + geom_point(size=3) + labs(y=NULL) + theme(legend.position=c(1, 0), legend.justification=c(1, 0))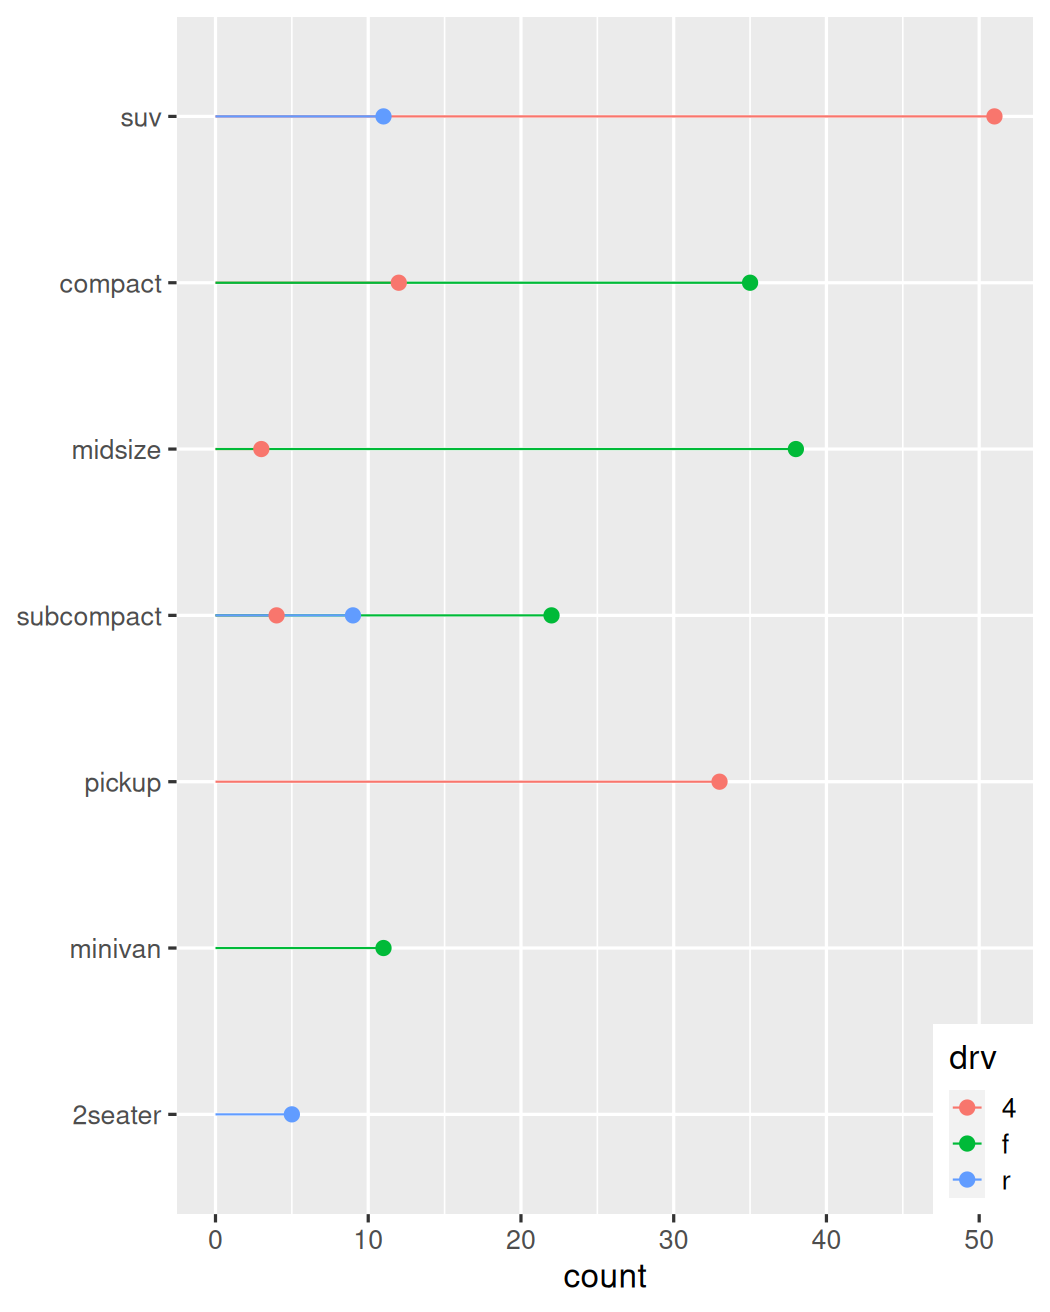
Ranking Lollipop
mpg |> count(drv, class, name="count") |> group_by(class) |> summarise(xmin = min(count), count = max(count)) |>ggplot() + aes(count, reorder(class, count, sum)) + geom_segment(aes(xend=xmin, yend=class)) + geom_point(size=3) + geom_point(aes(xmin), size=3) + labs(y=NULL) + expand_limits(x=0)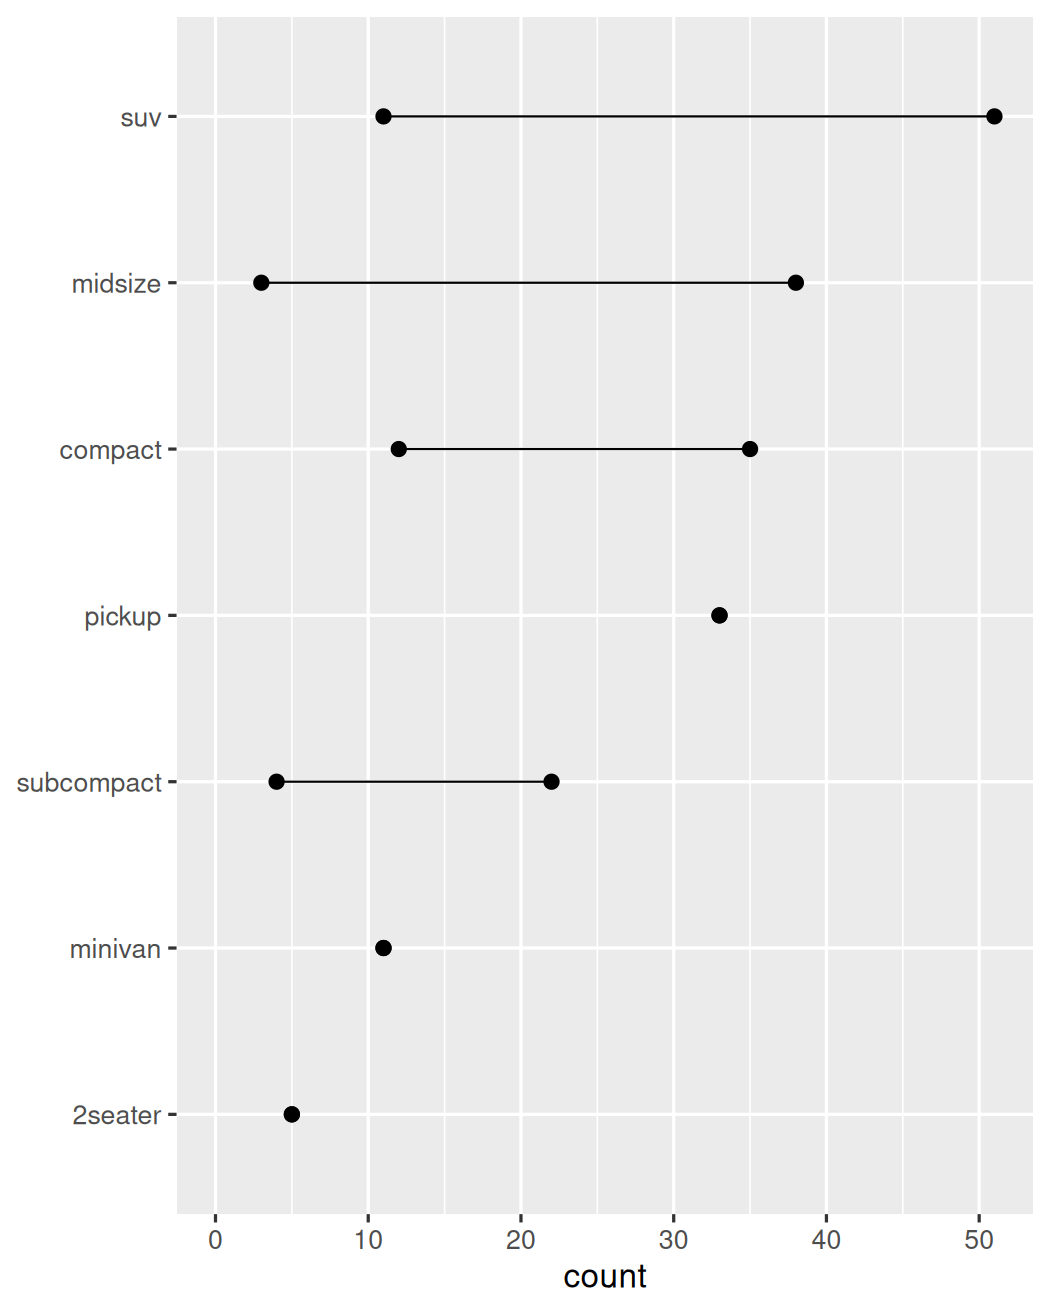
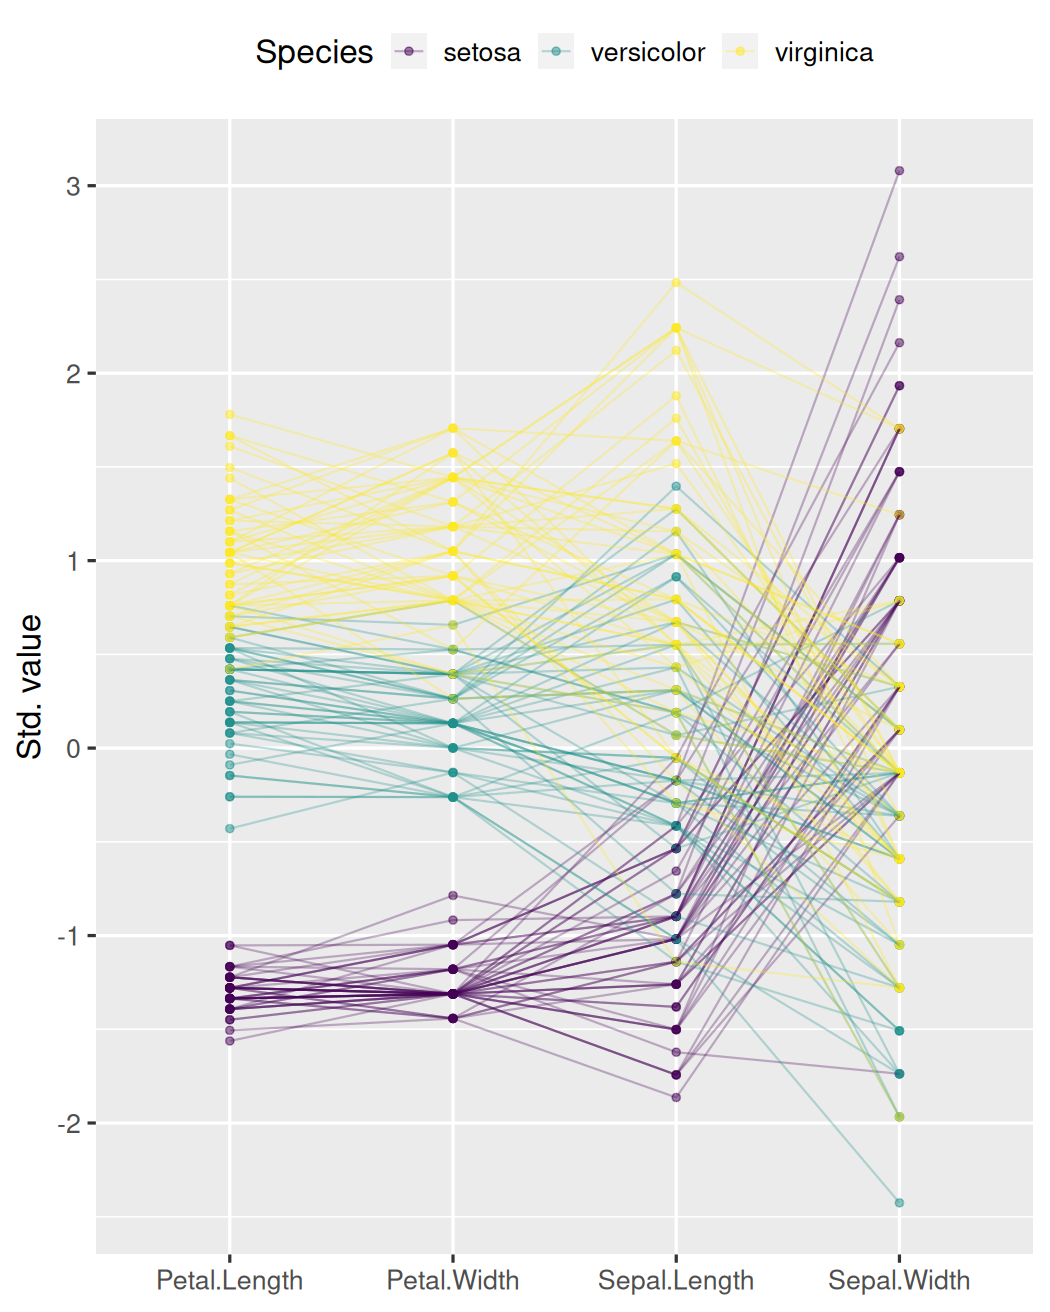
Ranking Parallel
iris |> tibble::rowid_to_column("id") |> gather("key", "value", -Species, -id) |>ggplot() + aes(key, value, color=Species) + geom_point(alpha=0.5) + geom_line(aes(group=id), alpha=0.3) + scale_color_viridis_d() + labs(x=NULL) + theme(legend.position="top")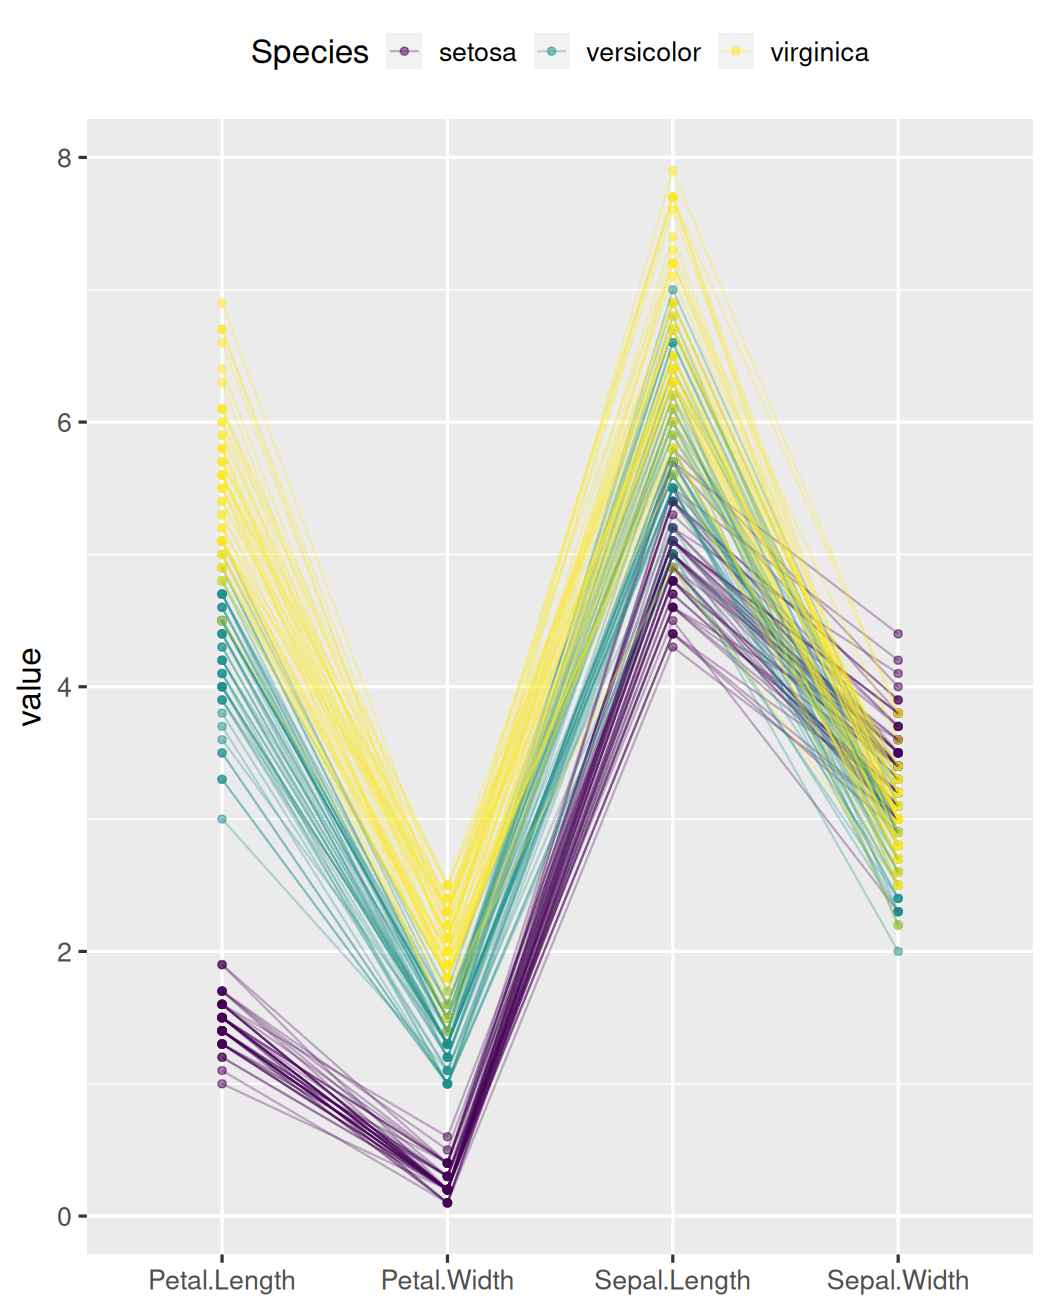
Ranking Parallel
iris |> tibble::rowid_to_column("id") |> gather("key", "value", -Species, -id) |> group_by(key) |> mutate(value = scale(value)) |>ggplot() + aes(key, value, color=Species) + geom_point(alpha=0.5) + geom_line(aes(group=id), alpha=0.3) + scale_color_viridis_d() + labs(x=NULL, y="Std. value") + theme(legend.position="top")