Data Visualization
Chapter 1. Fundamentals of Graphical Practice
Iñaki Úcar
Department of Statistics | uc3m-Santander Big Data Institute
Master in Computational Social Science
Licensed under Creative Commons Attribution CC BY 4.0 Last generated: 2023-09-27
Principles of Graphical Representation
Some Useful General Guidelines
Attitude
There are three basic questions that is very useful to keep asking yourself over and over again as you are designing new visual representations:
Attitude
There are three basic questions that is very useful to keep asking yourself over and over again as you are designing new visual representations:
- What is it for?
- What is the problem that I am trying to solve?
- What questions do I want my reader/user to be able to answer looking at this?
- What can I see here?
- What information can I extract out of this representation?
- How much effort is it needed to extract such information?
- How much confidence do I have in this information?
- How can I improve it?
- Being able to think about alternate solutions is
the most important skill
- Being able to think about alternate solutions is
General Guidelines
General Guidelines
- Do not over-aggregate data
General Guidelines
Do not over-aggregate data
Unit-based visualizations
- Every data item is represented by a single graphical mark
- Every data attribute is represented by a single channel
General Guidelines
Do not over-aggregate data
Unit-based visualizations
- Every data item is represented by a single graphical mark
- Every data attribute is represented by a single channel
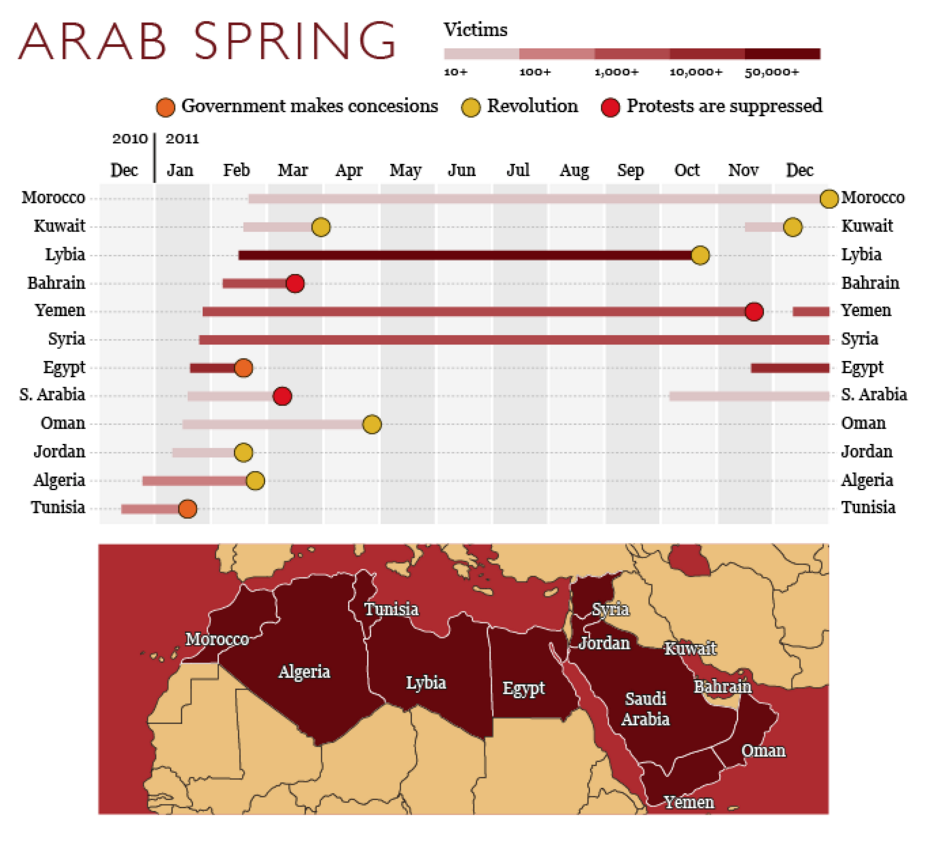
Tufte's high-information graphics
- "Data-rich designs give context and credibility to statistical evidence"
- "High-density graphics help us compare parts of the data by displaying much information within the view of the eye"
- Keep a critical attitude

