Acclaimed Historic Examples
- Joseph Priestley, 1765: first timeline chart as visual aid for his lectures
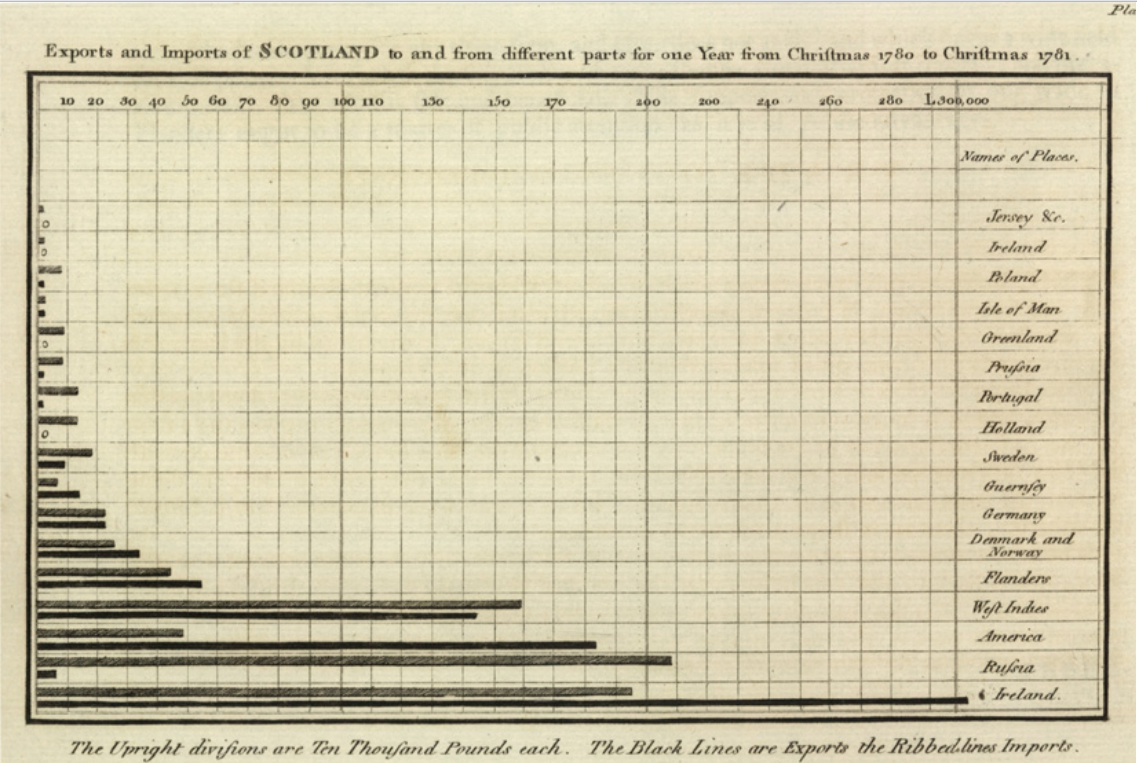
Acclaimed Historic Examples
- William Playfair, 1786: first bar chart
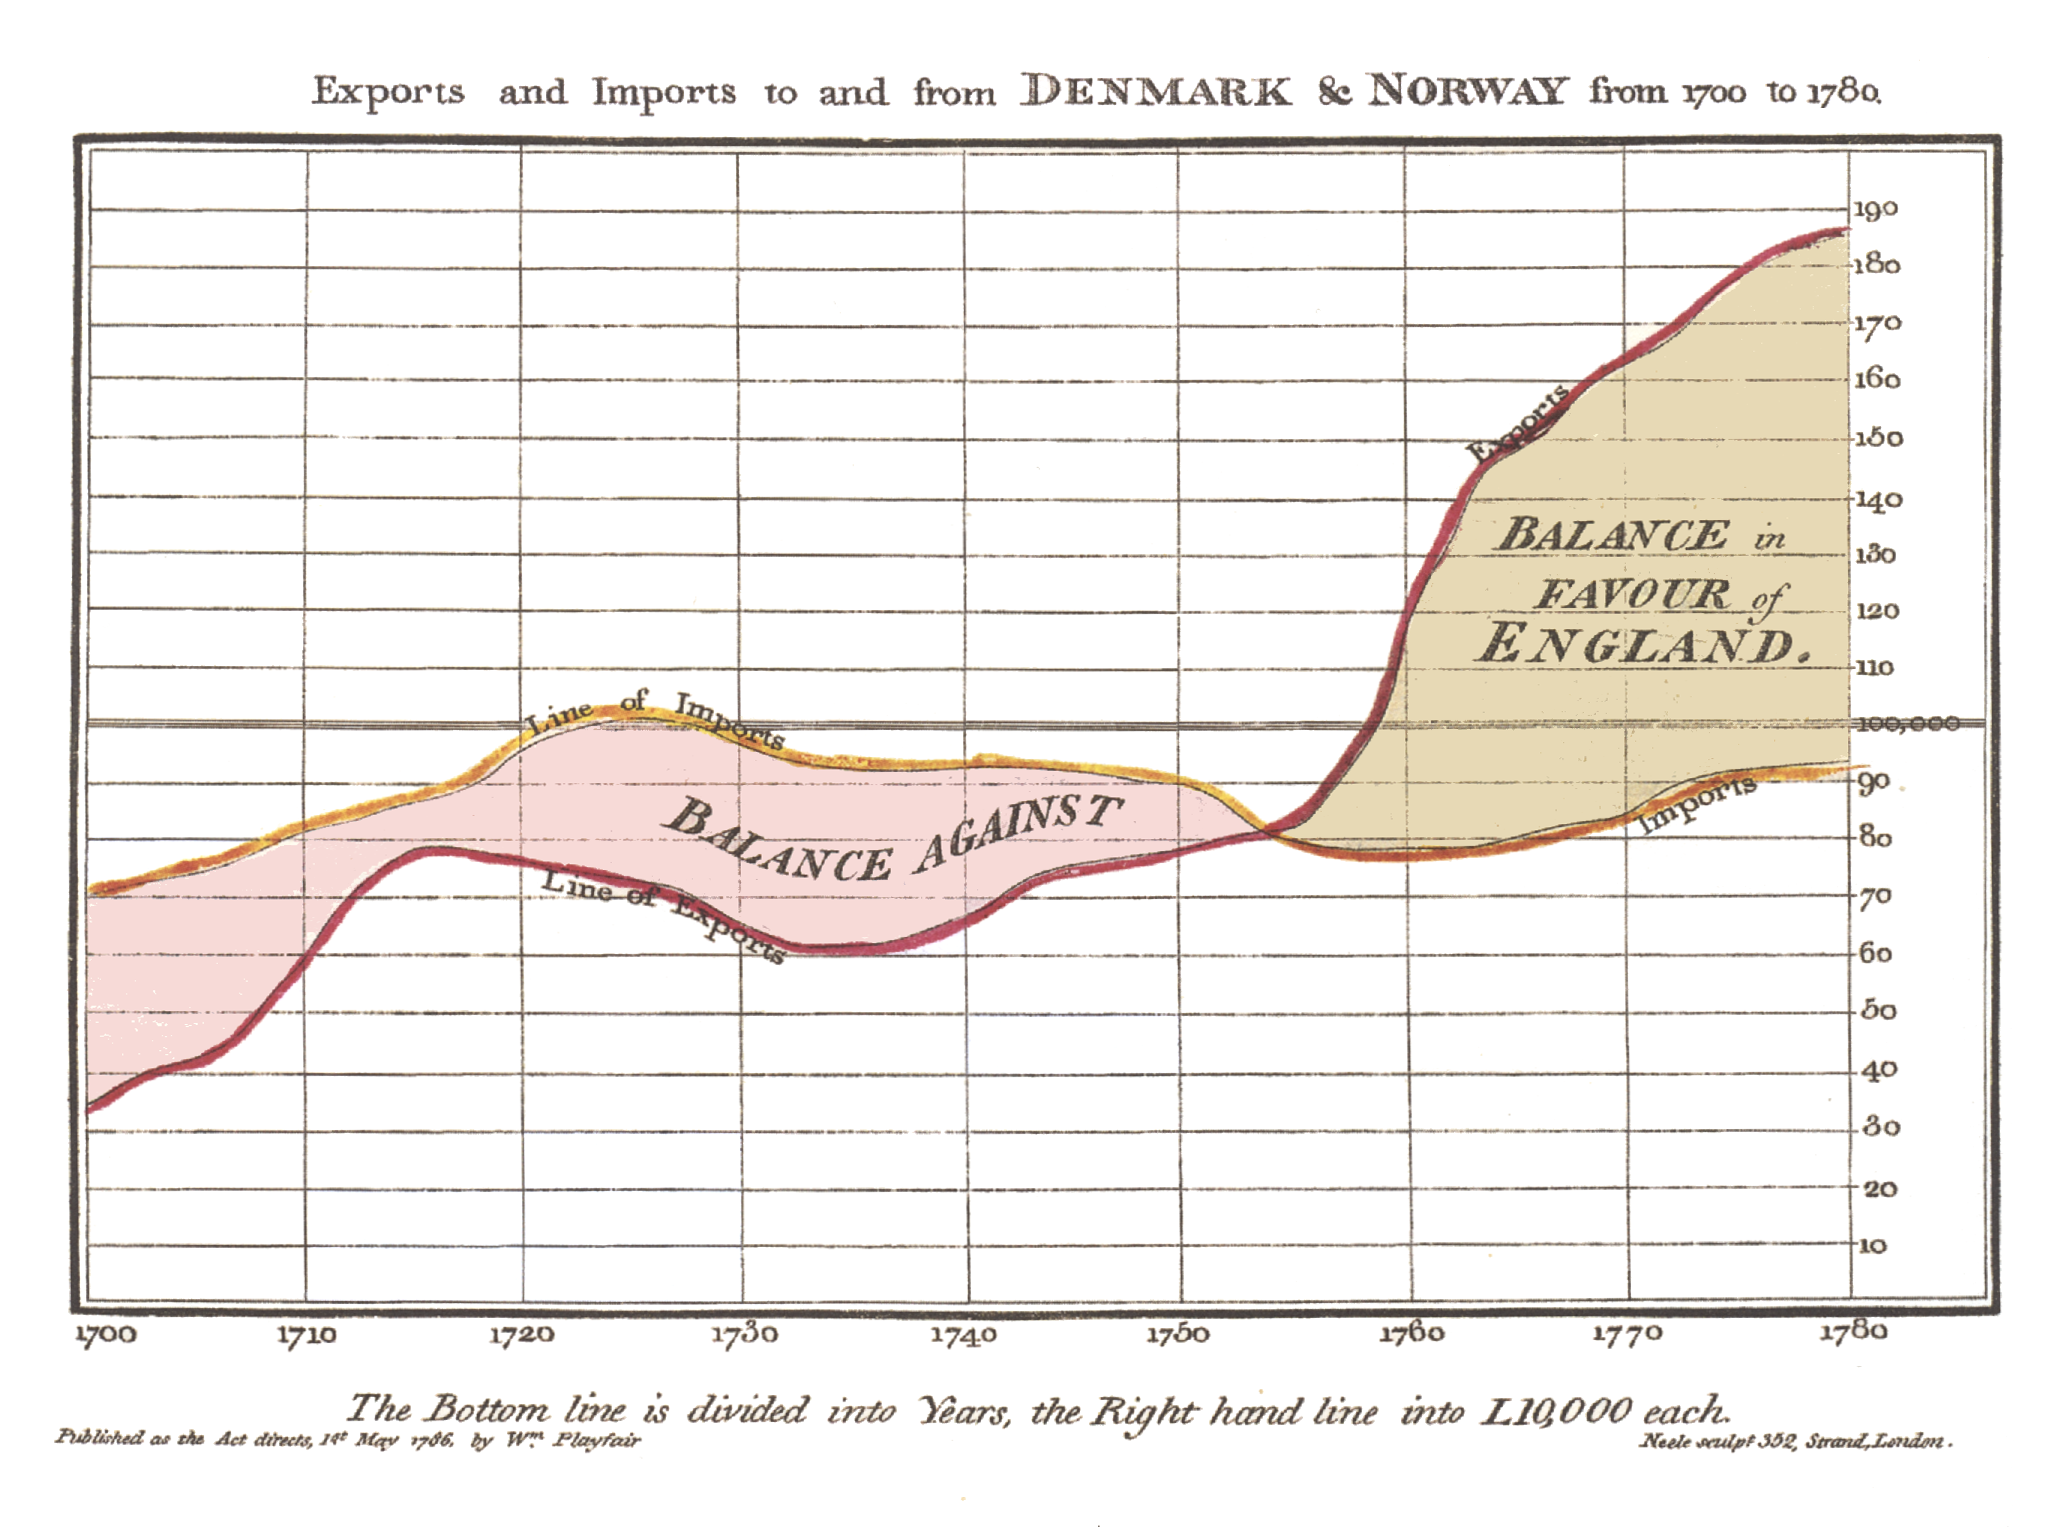
Acclaimed Historic Examples
- William Playfair, 1786: first line (timeseries) chart
Acclaimed Historic Examples
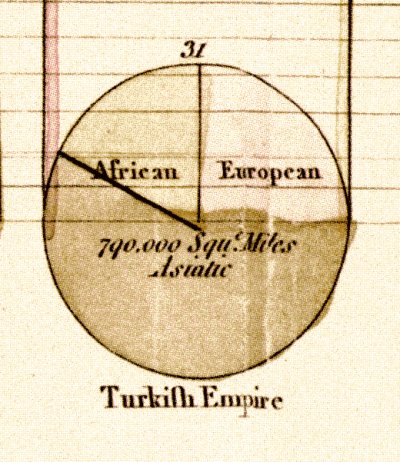
- William Playfair, 1789: first pie chart (sadly)
Acclaimed Historic Examples
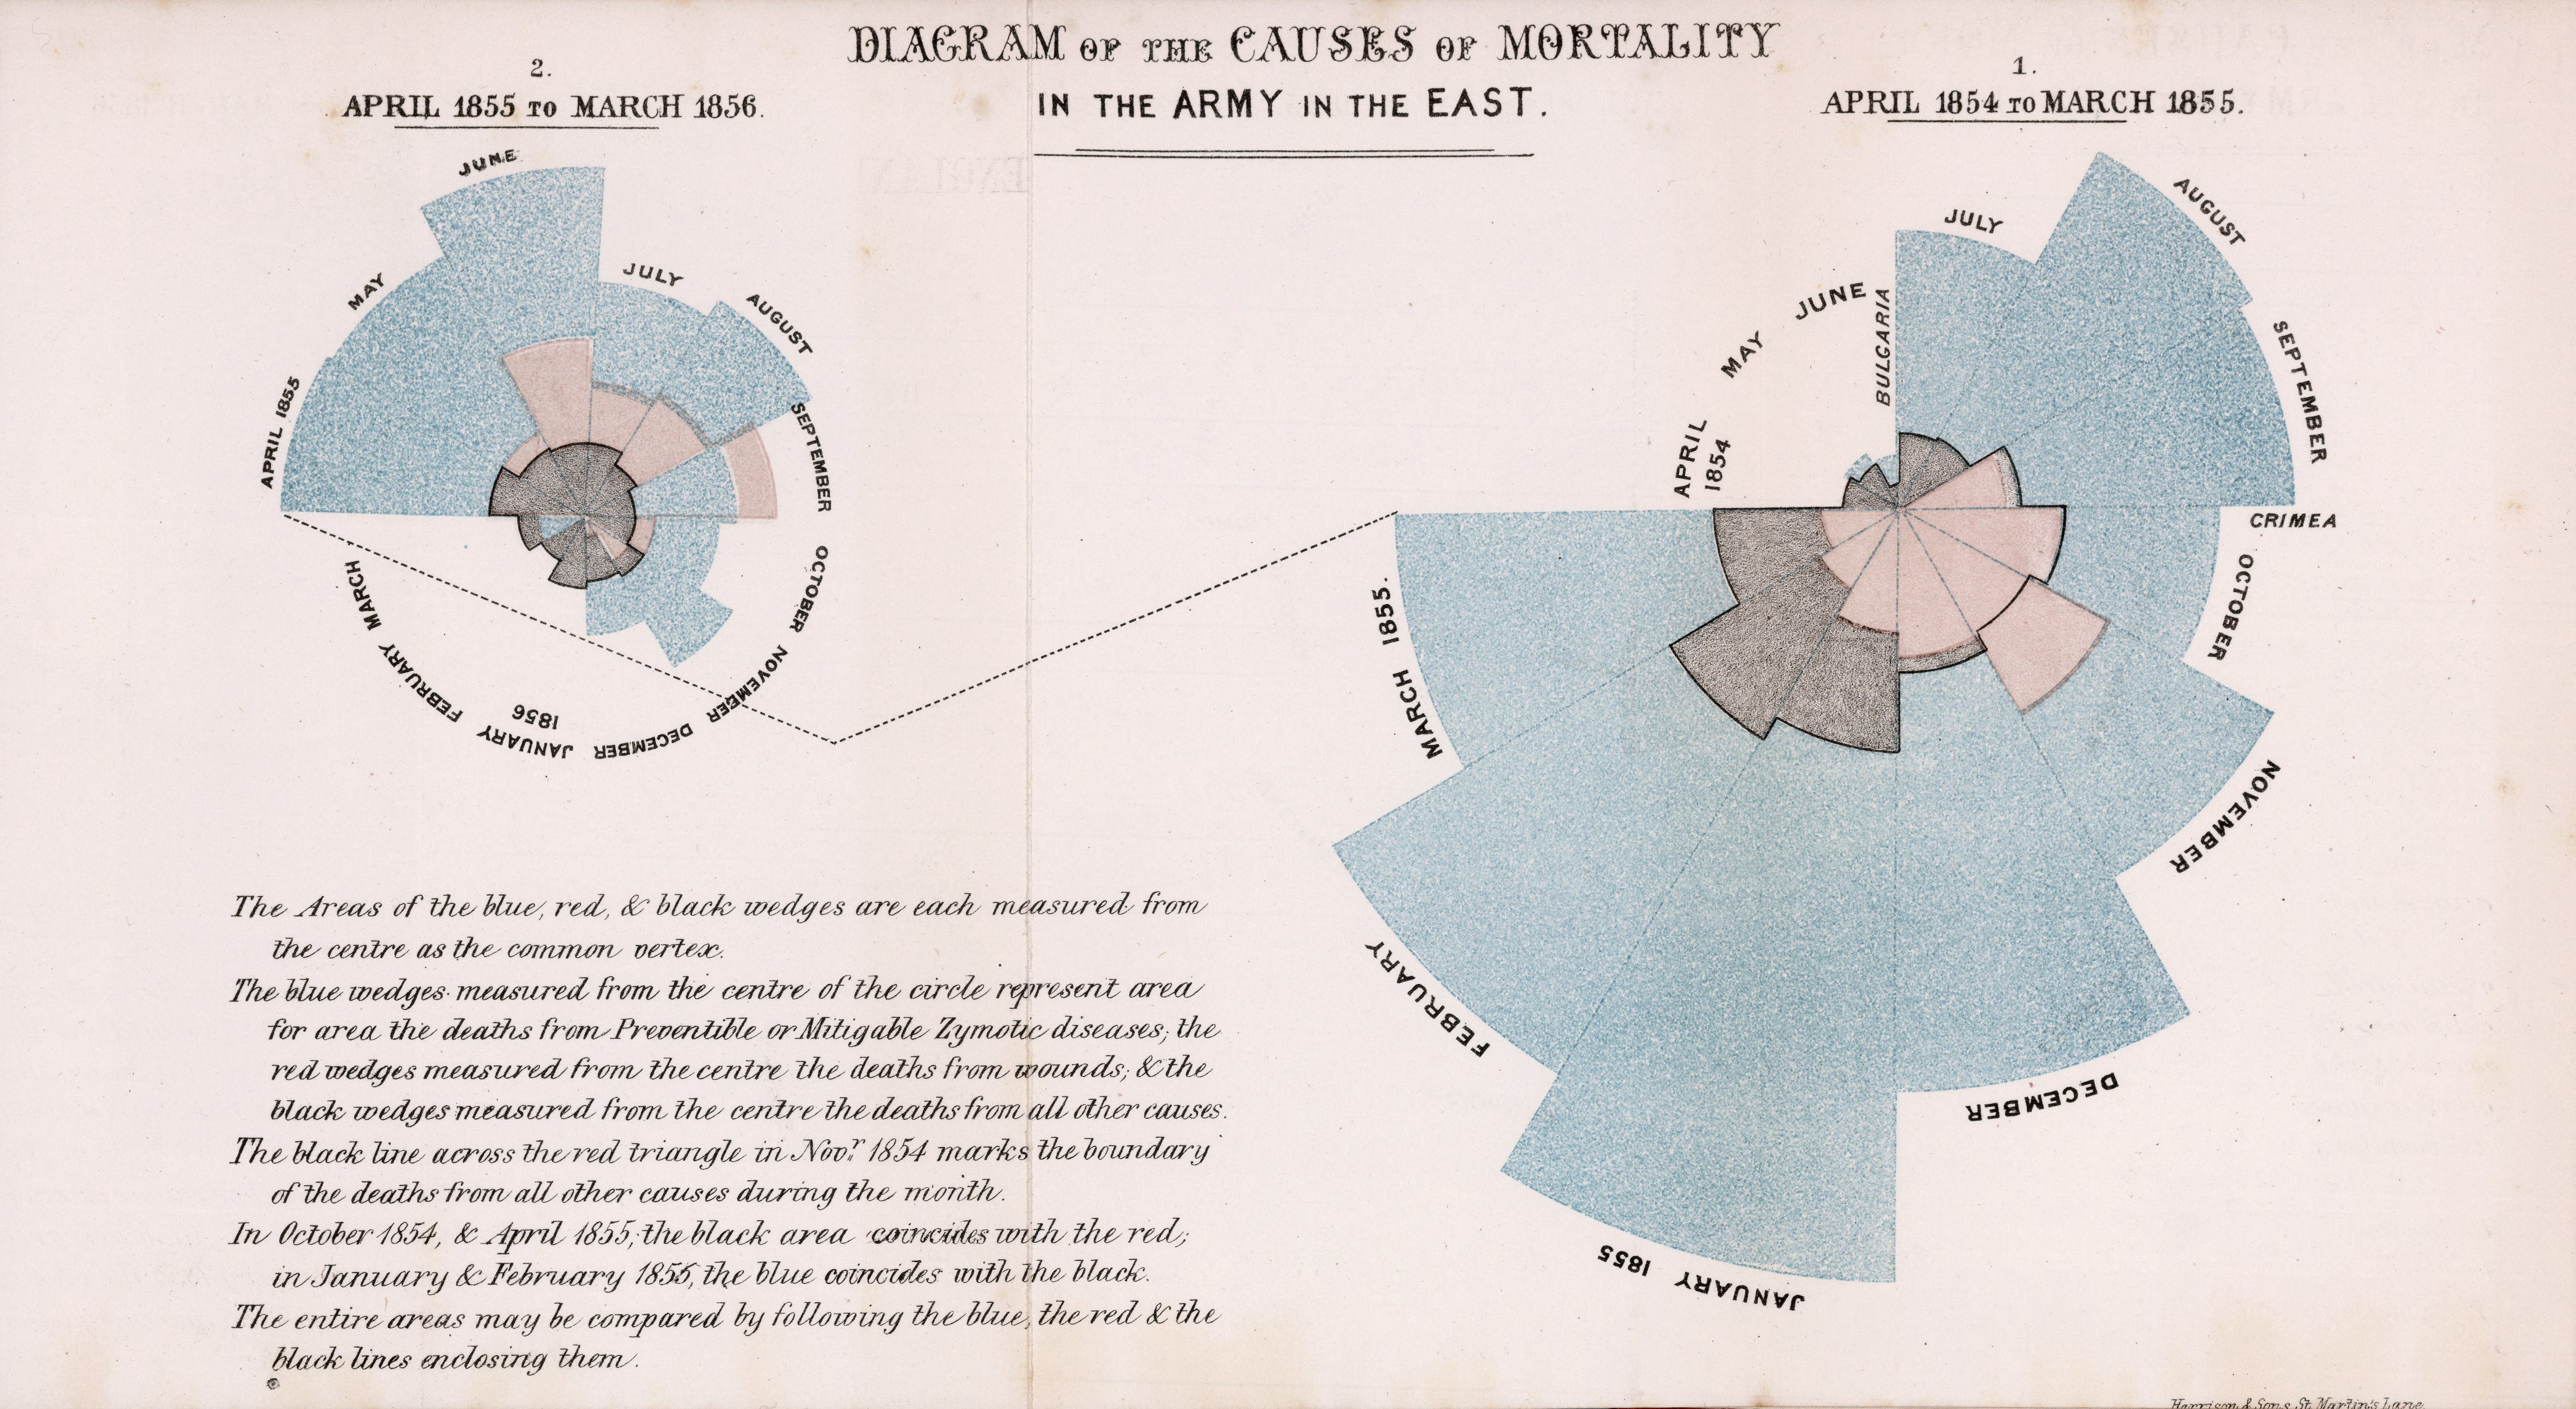
- Florence Nightingale, 1858: polar area diagram that convinced the British Government to improve army hygiene
Acclaimed Historic Examples
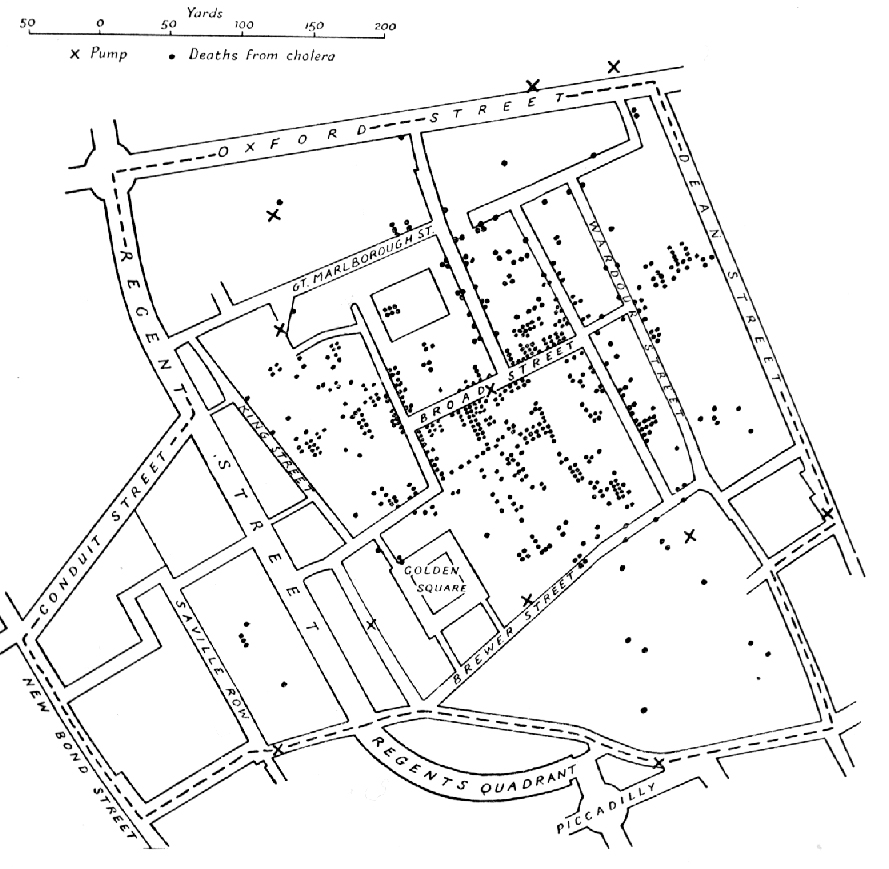
- John Snow, 1854: map of cholera cases that helped identify the source
Acclaimed Historic Examples
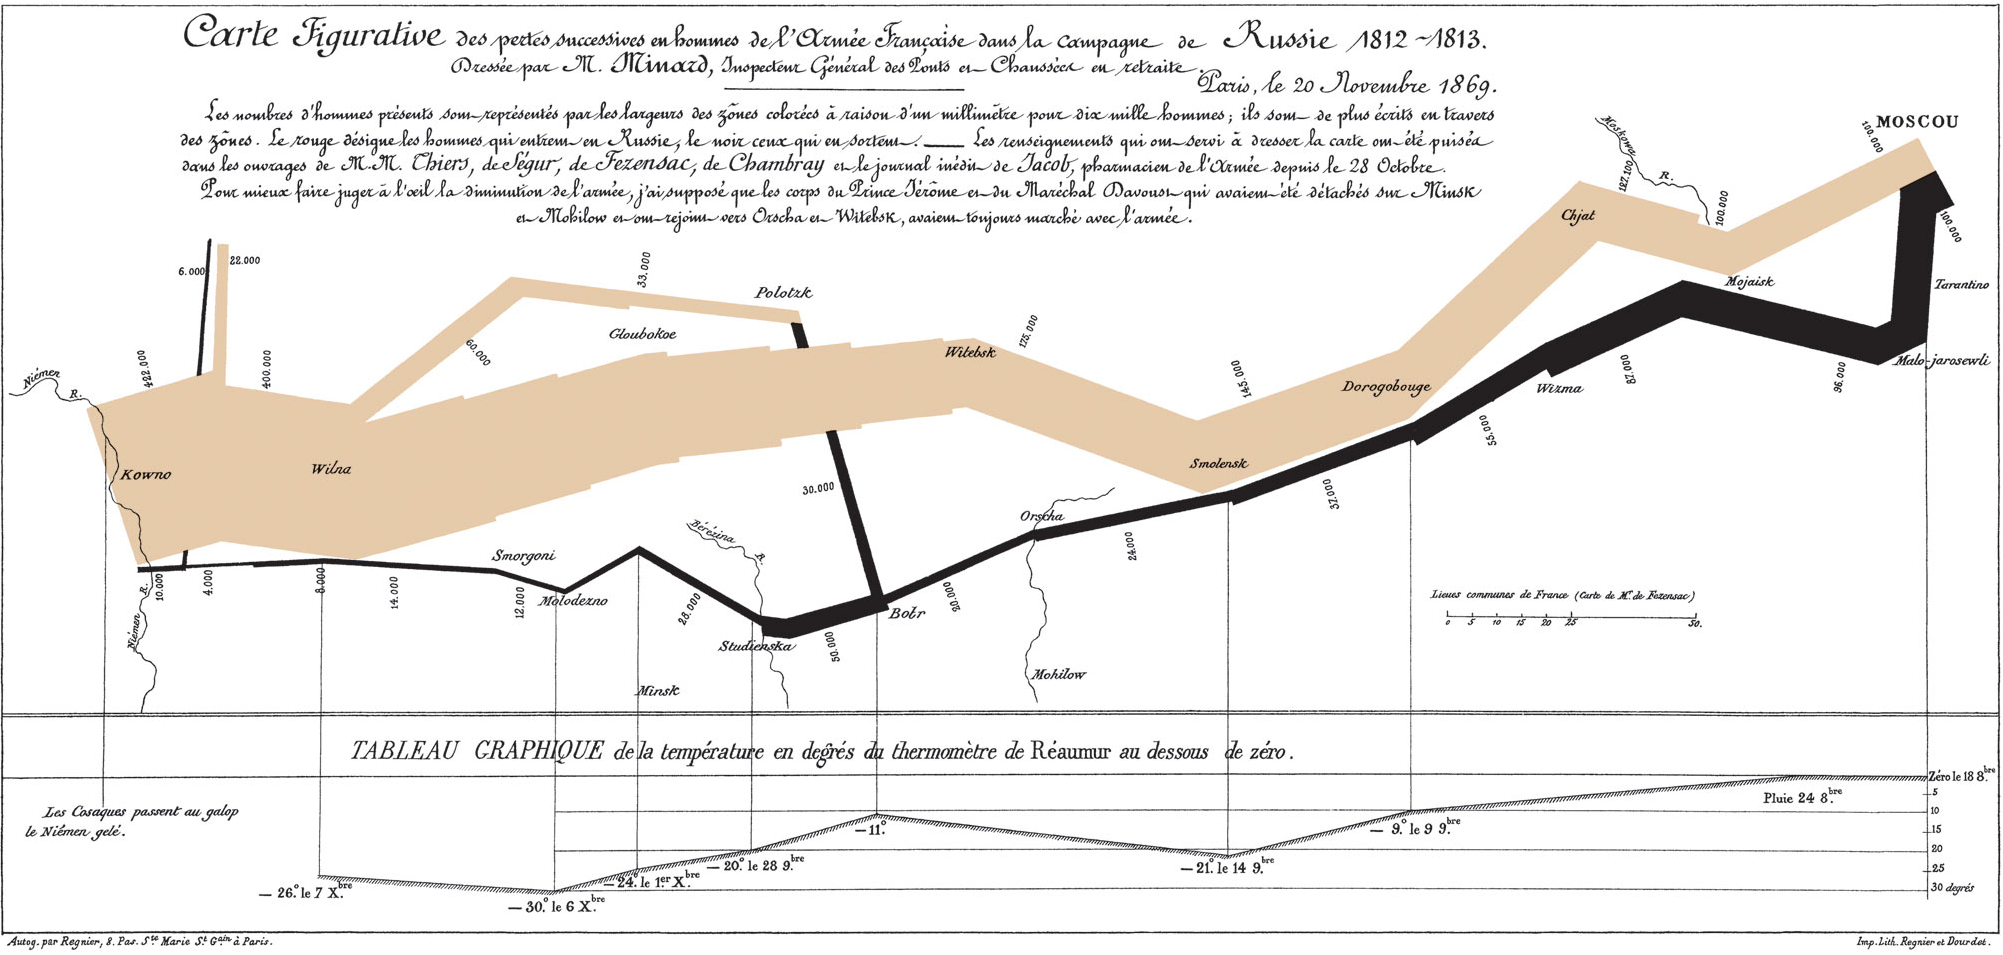
- Charles Joseph Minard, 1869: first flow chart depicting Napoleon's 1812 Russian campaing
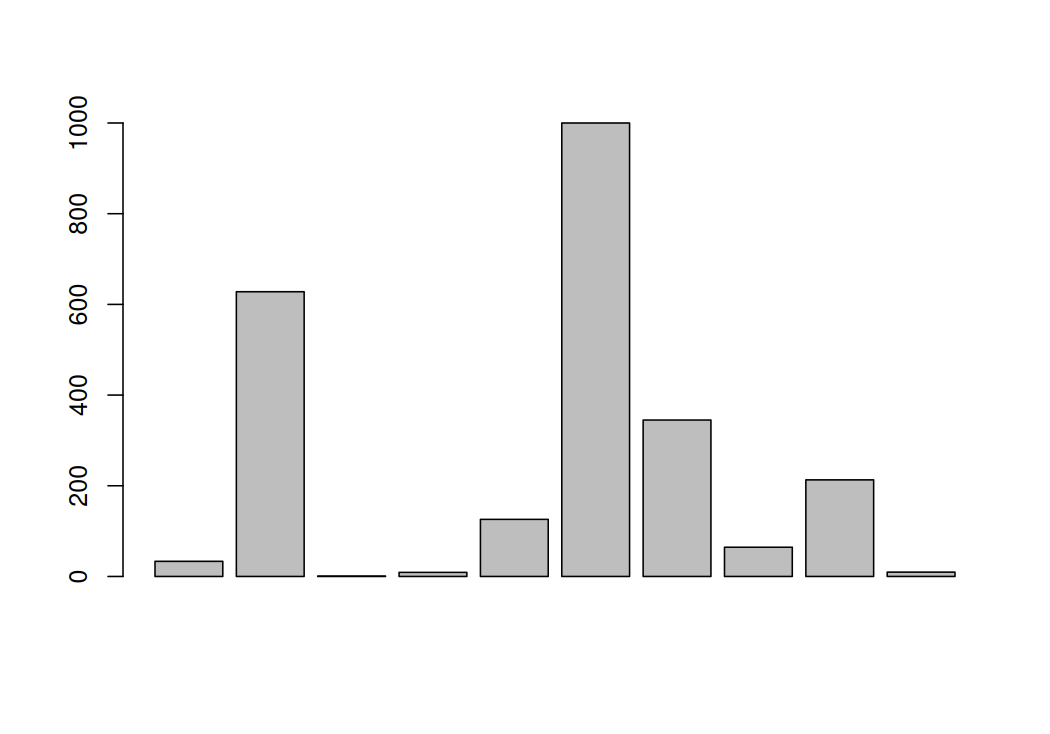
Example: Find the Highest Number
| 345 |
| 33.4 |
| 627.8654 |
| 1.0057632 |
| 9 |
| 9.5678 |
| 64.5 |
| 213 |
| 1000 |
| 125.89876 |
| 33.40 |
| 627.87 |
| 1.01 |
| 9.00 |
| 125.90 |
| 1000.00 |
| 345.00 |
| 64.50 |
| 213.00 |
| 9.57 |
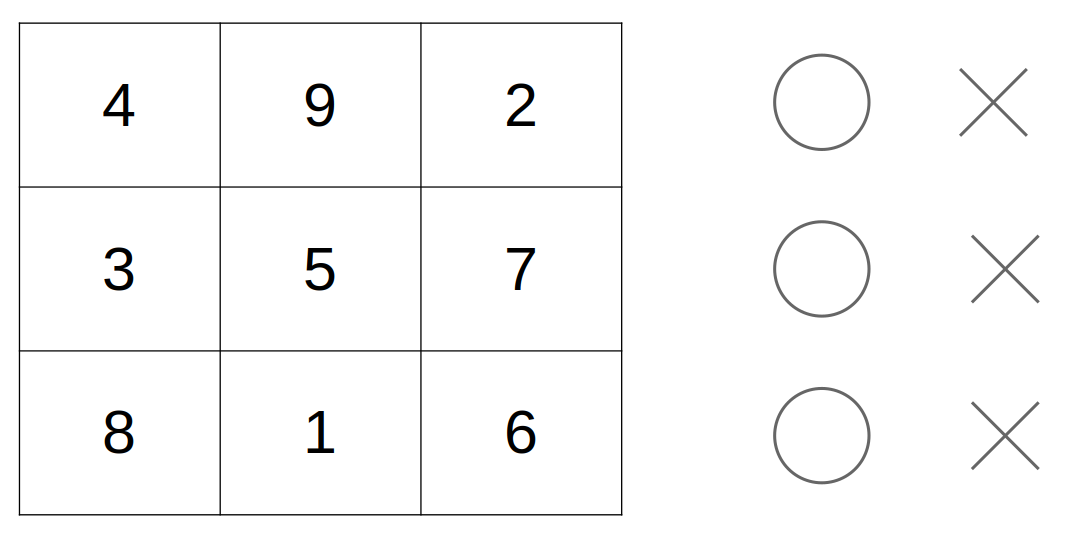
Example: The Game of 15
From Prof. Pat Hanrahan's EuroVis'09 keynote talk
There are 2 players
Each player takes a digit in turn
Once a digit is taken, it cannot be used again
The first player to get three digits that sum to 15 wins
{1, 2, 3, 4, 5, 6, 7, 8, 9}
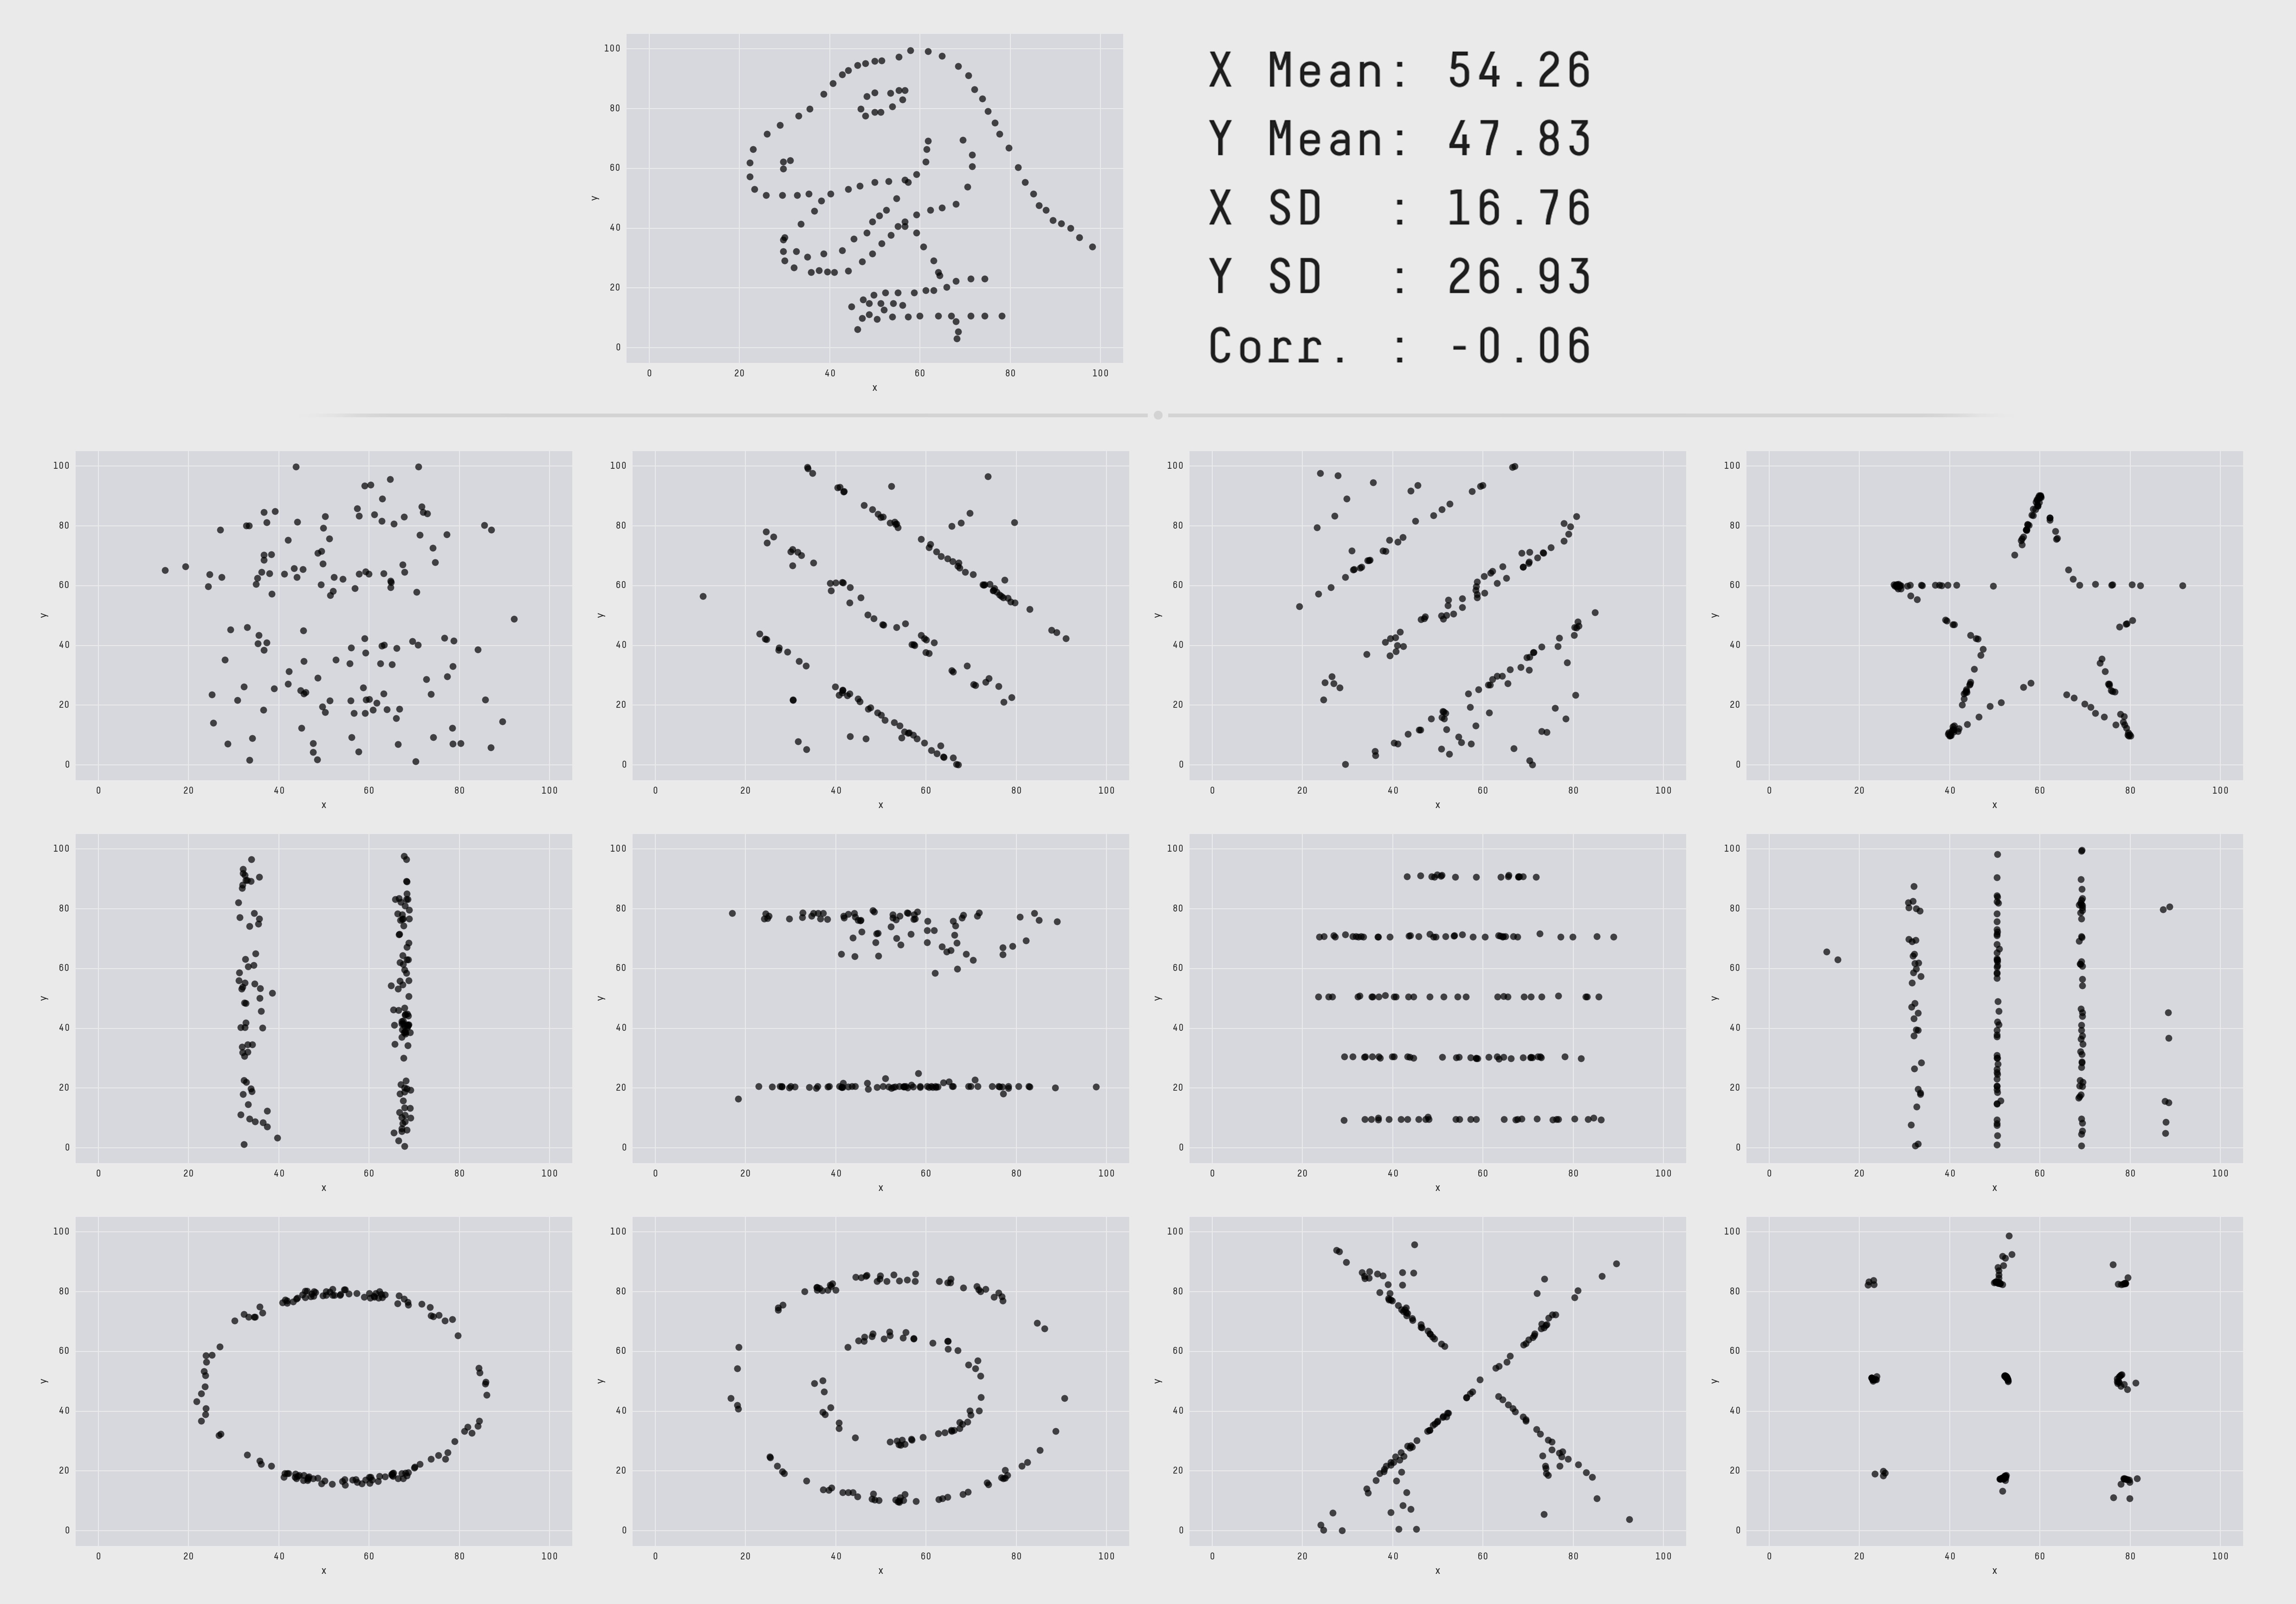
Example: Anscombe's Quartet

Example: Datasaurus
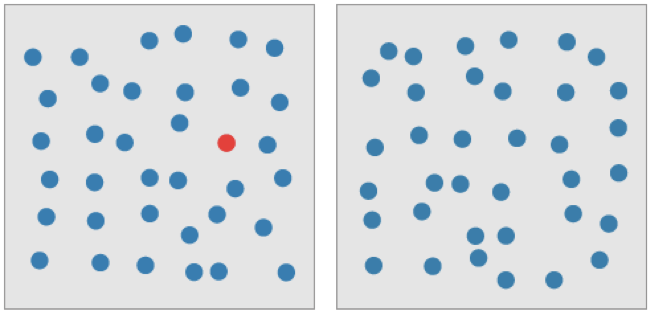
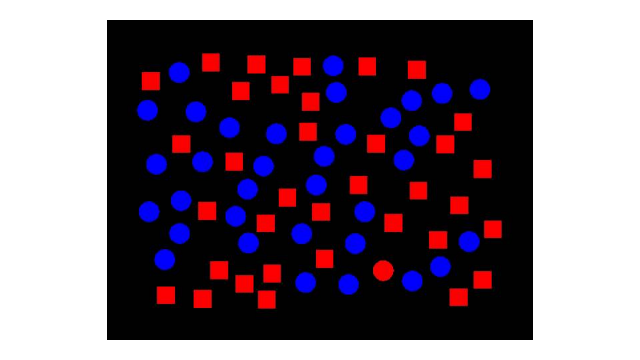
Example: Preattentive Processing
How to Make Graphs?
Data -> Mapping -> Visual Representation -> Perception
- Opportunity + Responsibility
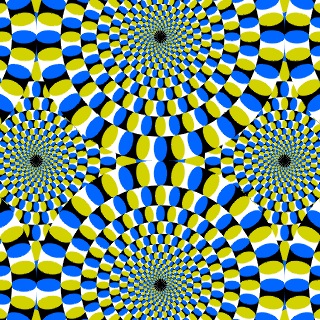
- We can also easily fool ourselves
- We need to know how our visual perception works
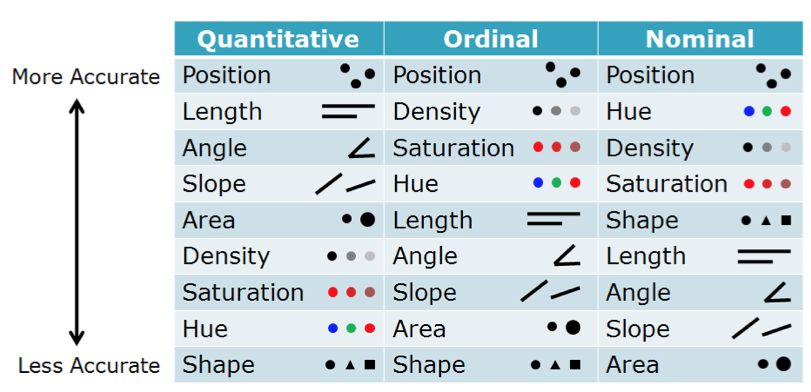
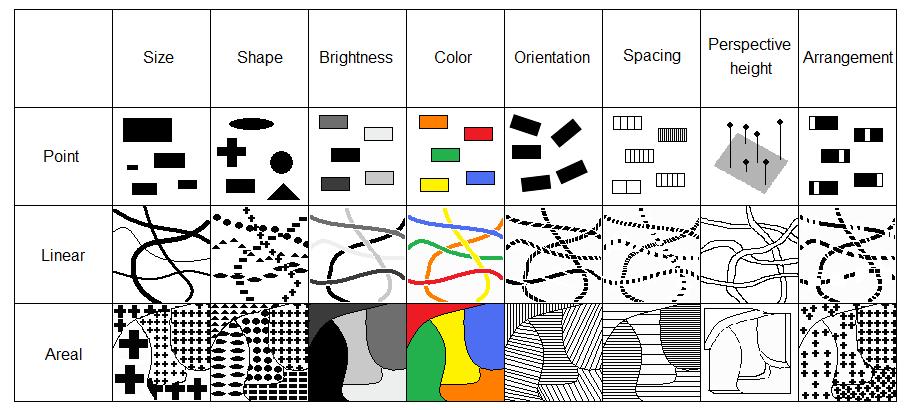
Visual Representation
- Visual variables, marks and channels
- Their best use and limitations
Visual Mapping
- How to best map data features to visual features
- What options are available (visualization toolbox)
- How computer algorithms realize the mapping and turn data into images