Elements of Visual Encoding
- Data items: sales
- Data attributes: price, profit, product type
- Visual marks: point
- Visual channels: xy position, color
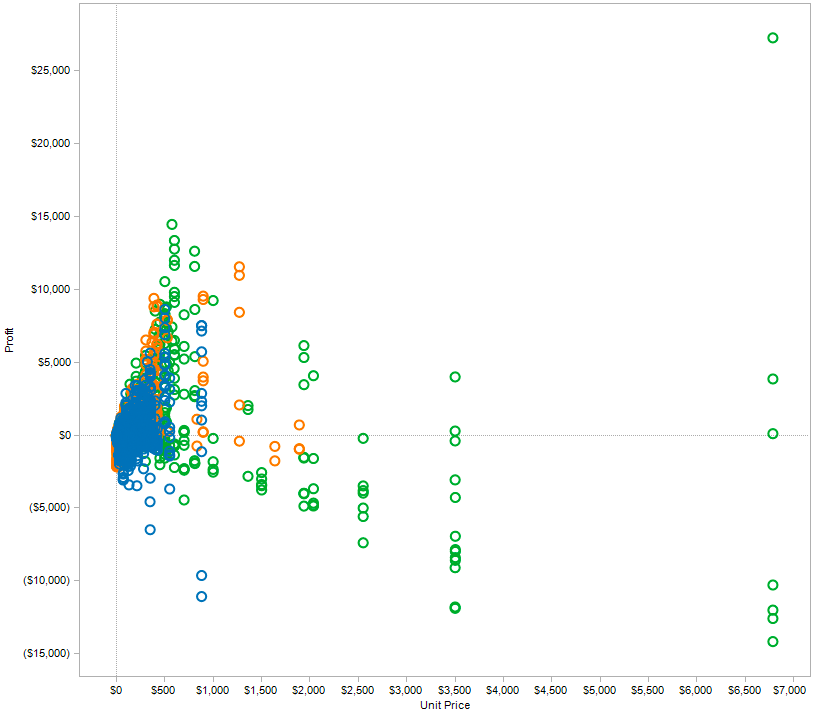
- Encoding rules:
- sale => point
- price and profit => xy position
- product type => color
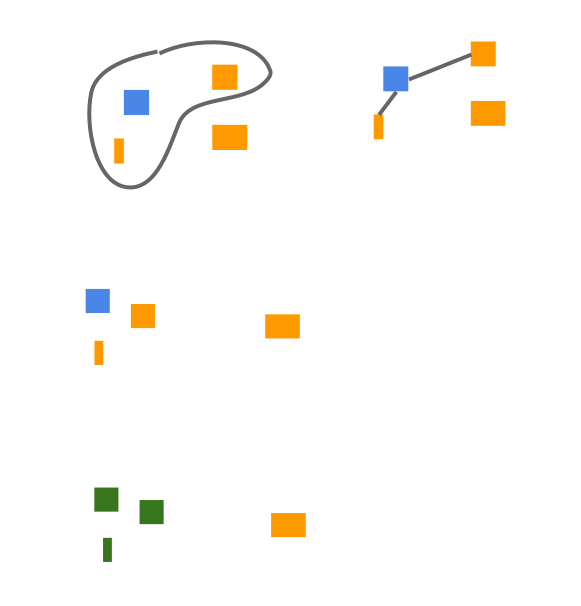
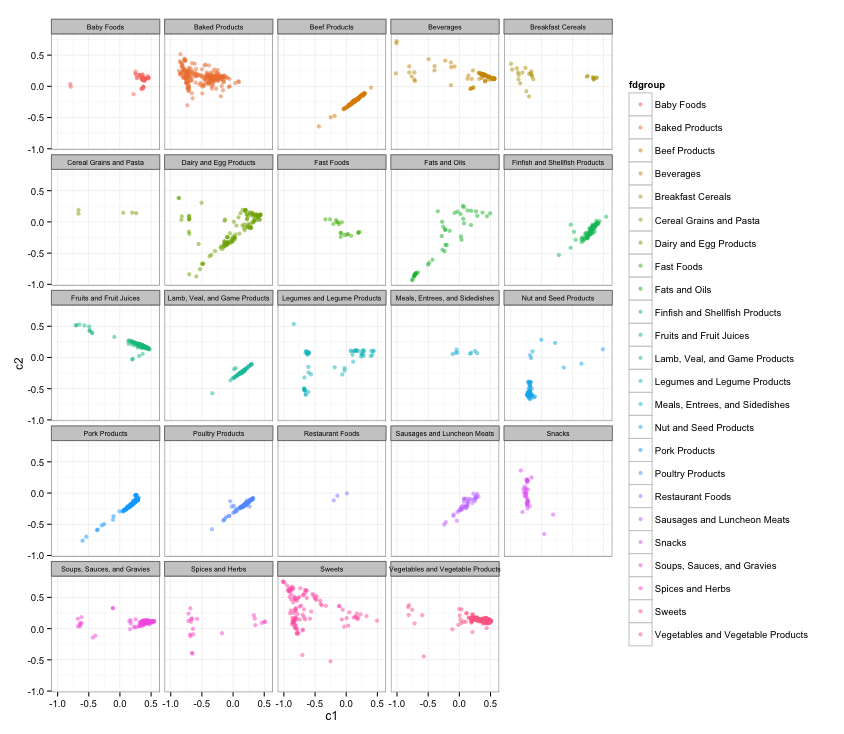
Elements of Visual Encoding
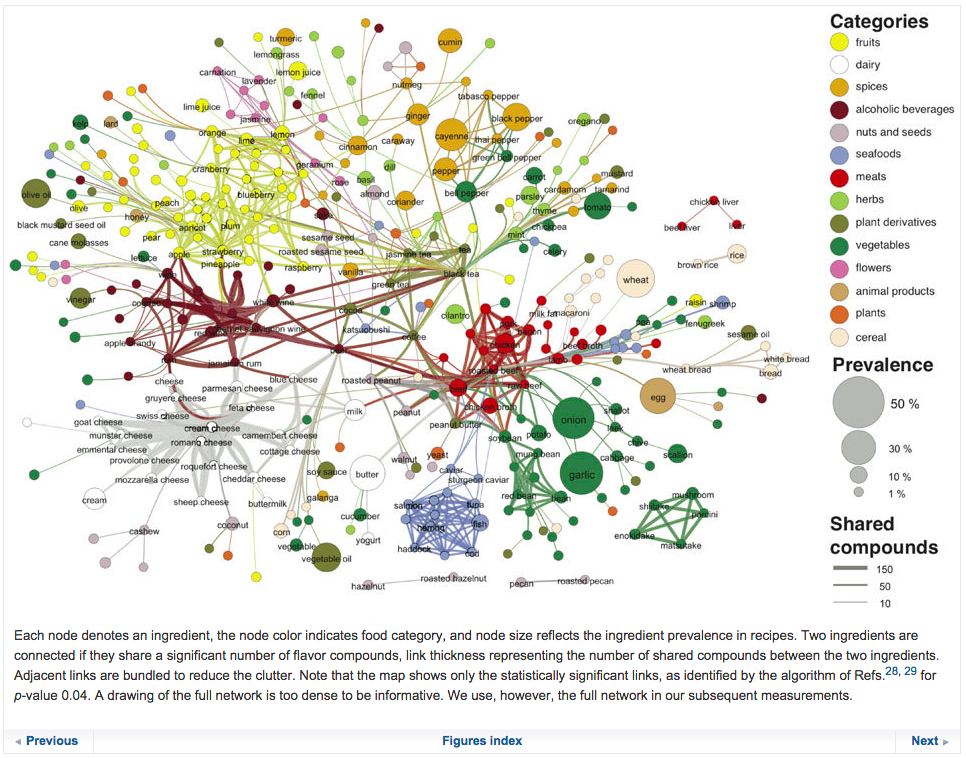
- Data items: co-occurrences
- Data attributes: name, cluster, frequency
- Visual marks: point
- Visual channels: xy position, hue, intensity
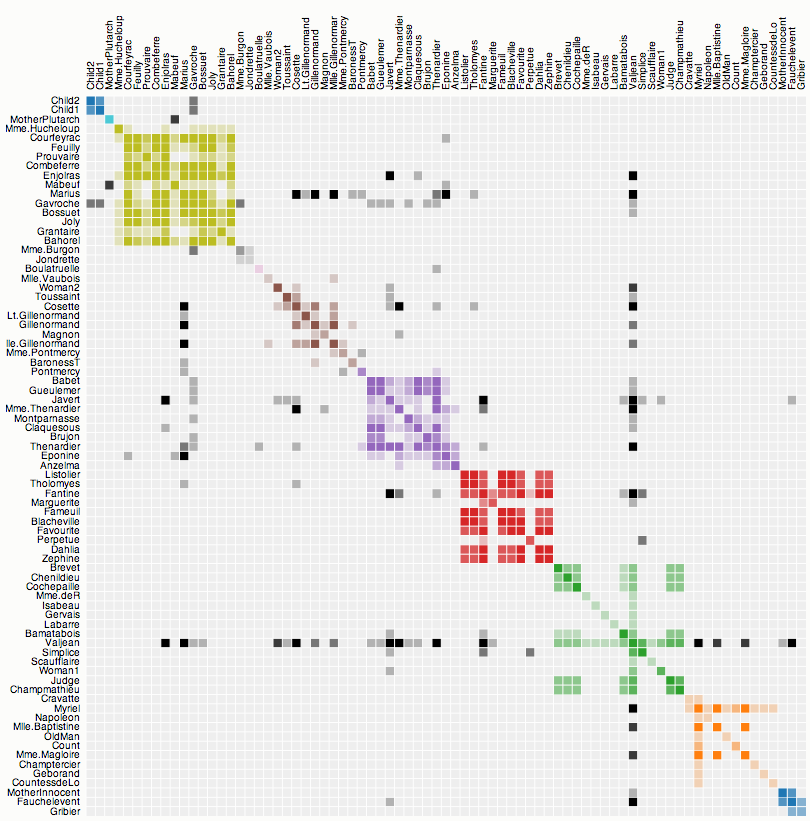
- Encoding rules:
- co-occurrences => point
- name => xy position
- cluster => hue, containment
- frequency => intensity
Elements of Visual Encoding
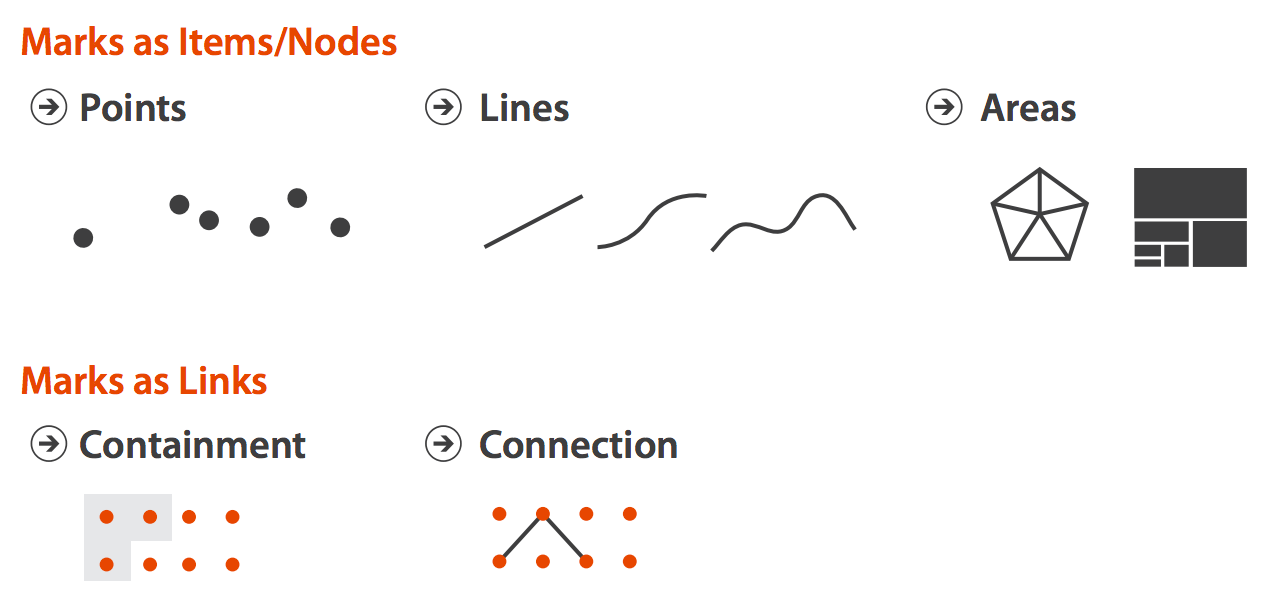
Visual marks are the basic visual objects/units that represent data objects visually
Elements of Visual Encoding
Visual channels are visual variables we can use to represent characteristics of visual objects
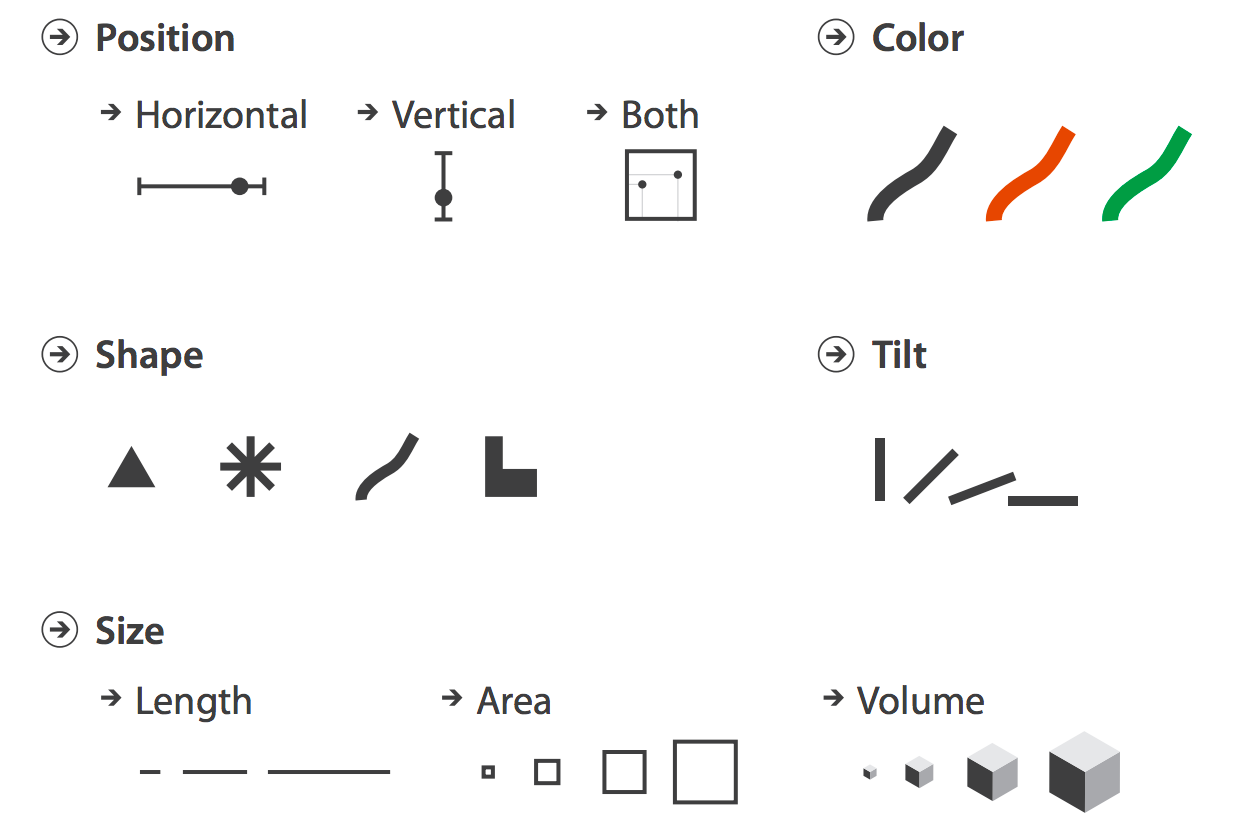
Elements of Visual Encoding

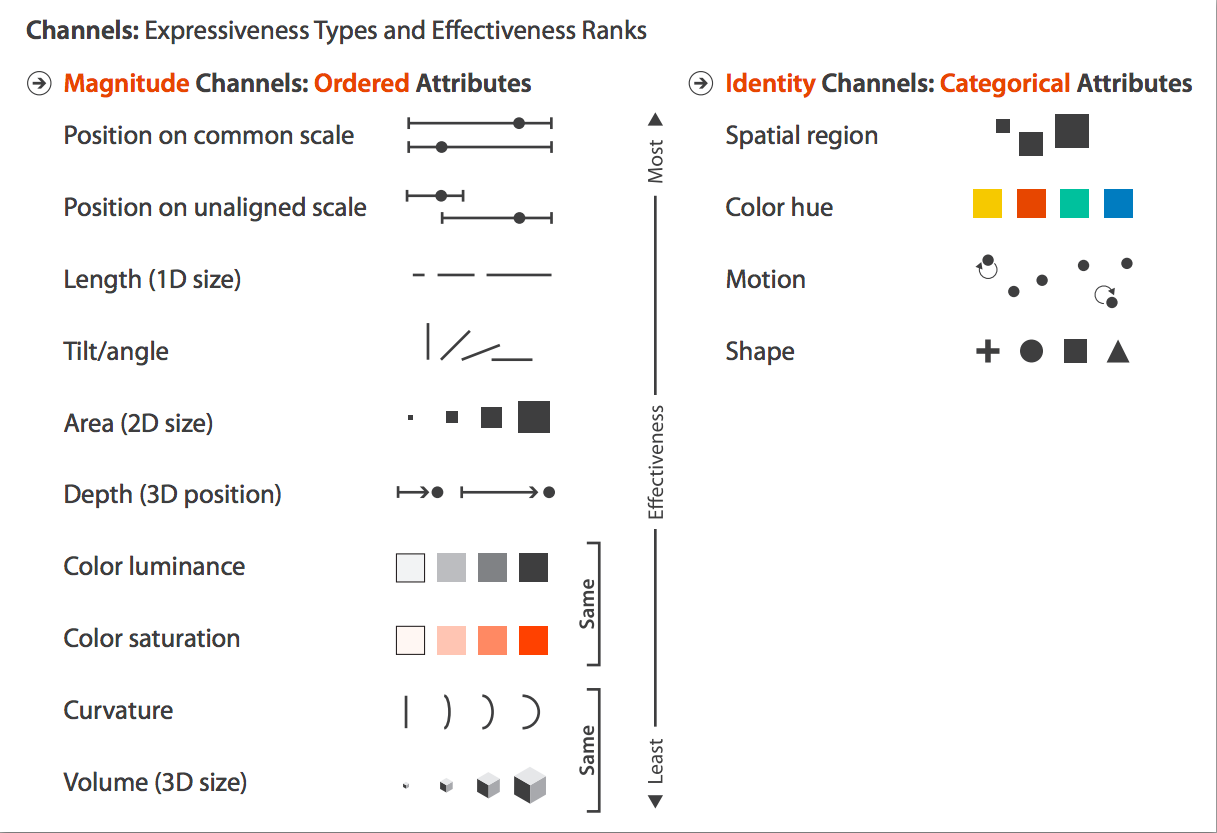
Elements of Visual Encoding
Identity channels: information about what, who, where something is
- Example: color hue is suitable for categories
Magnitude channels: information about how much
- Example: position is suitable for quantities
Elements of Visual Encoding
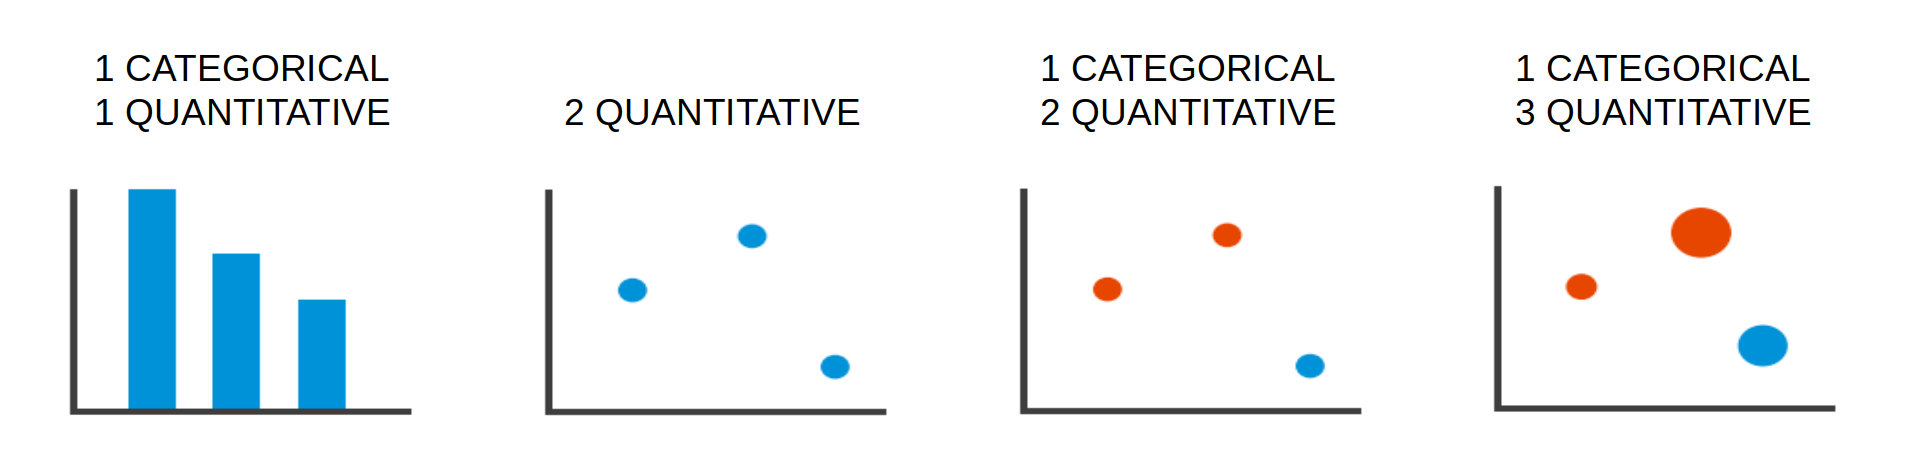
For each of the following, identify:
- Data item 1 => visual mark 1
- Data item 2 => visual mark 2
- ...
- Data attribute 1 => visual channel 1
- Data attribute 2 => visual channel 2
- ...
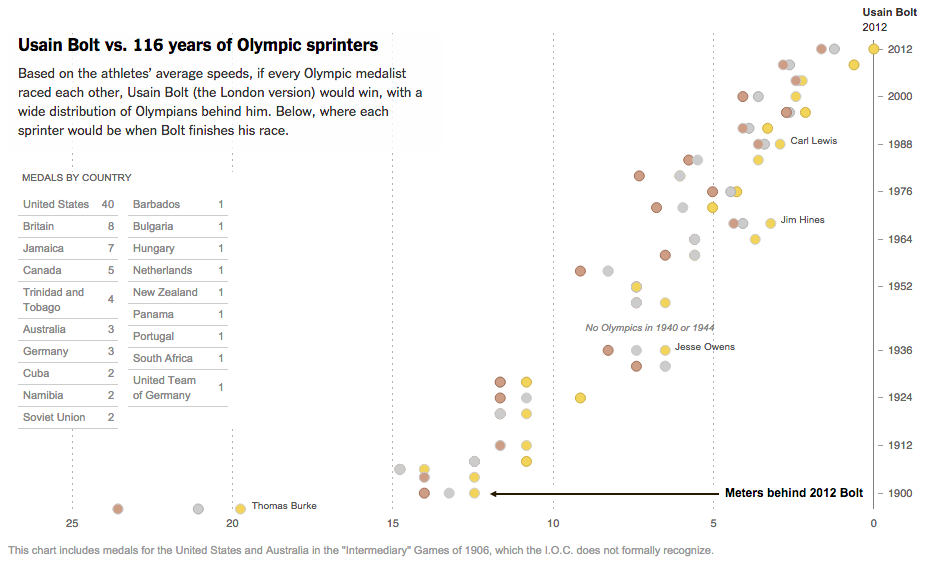
Source: New York Times
Source: Gapminder

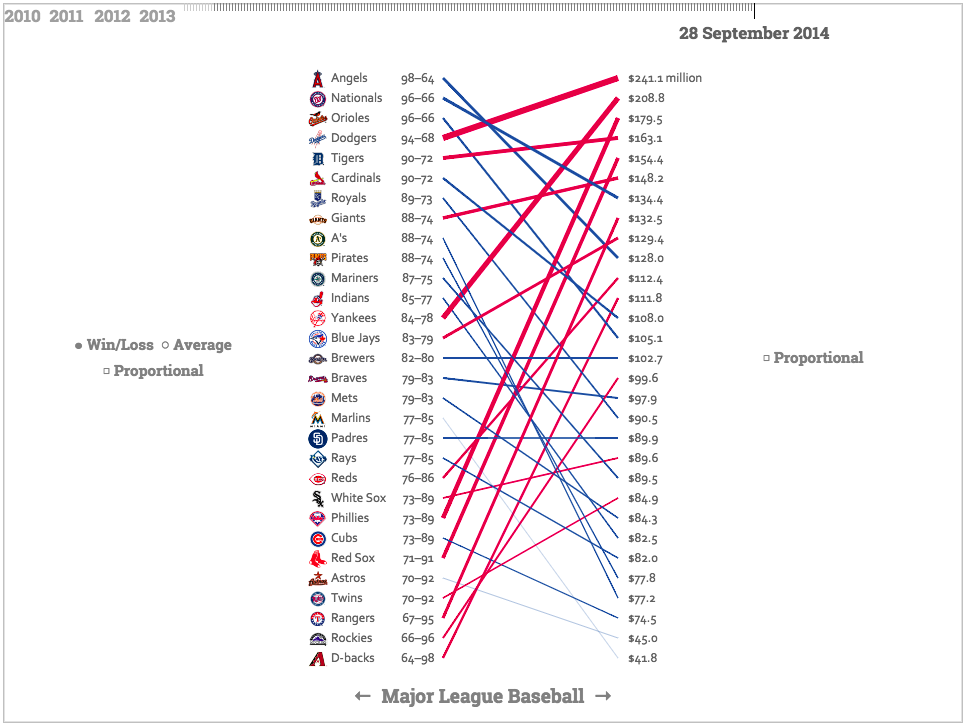
Source: Fathom
Source: Cargo Collective
Source: New York Times

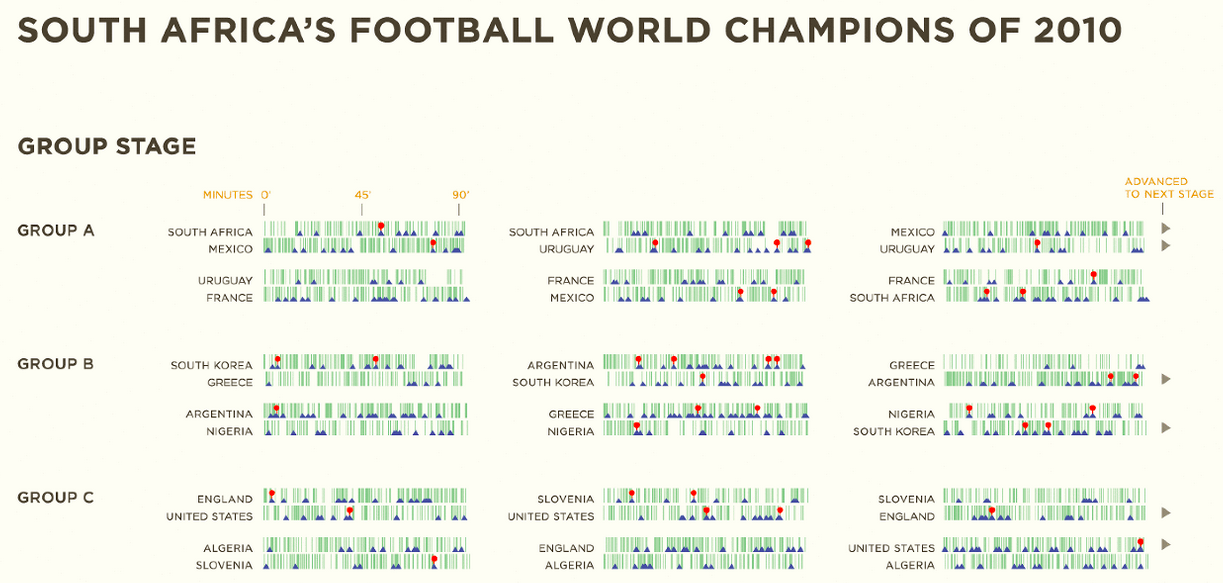
Source: Nature
Example: What Does Position Encode?

Effectiveness Rank
Accuracy
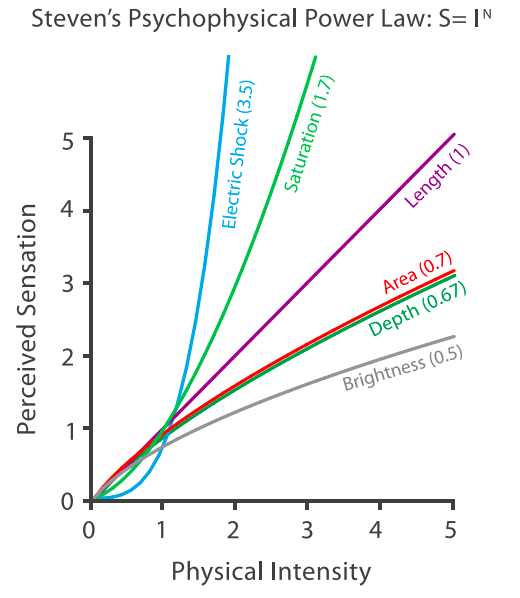
Accuracy
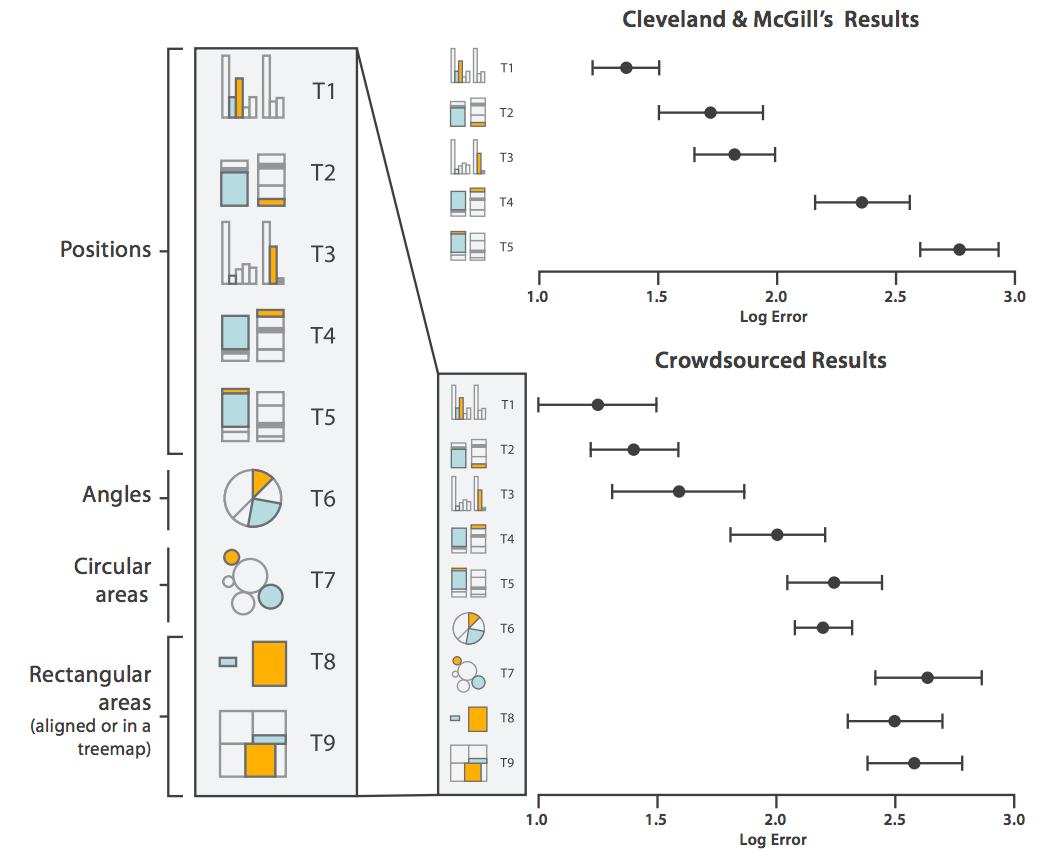
Accuracy
Source: Stephen Few
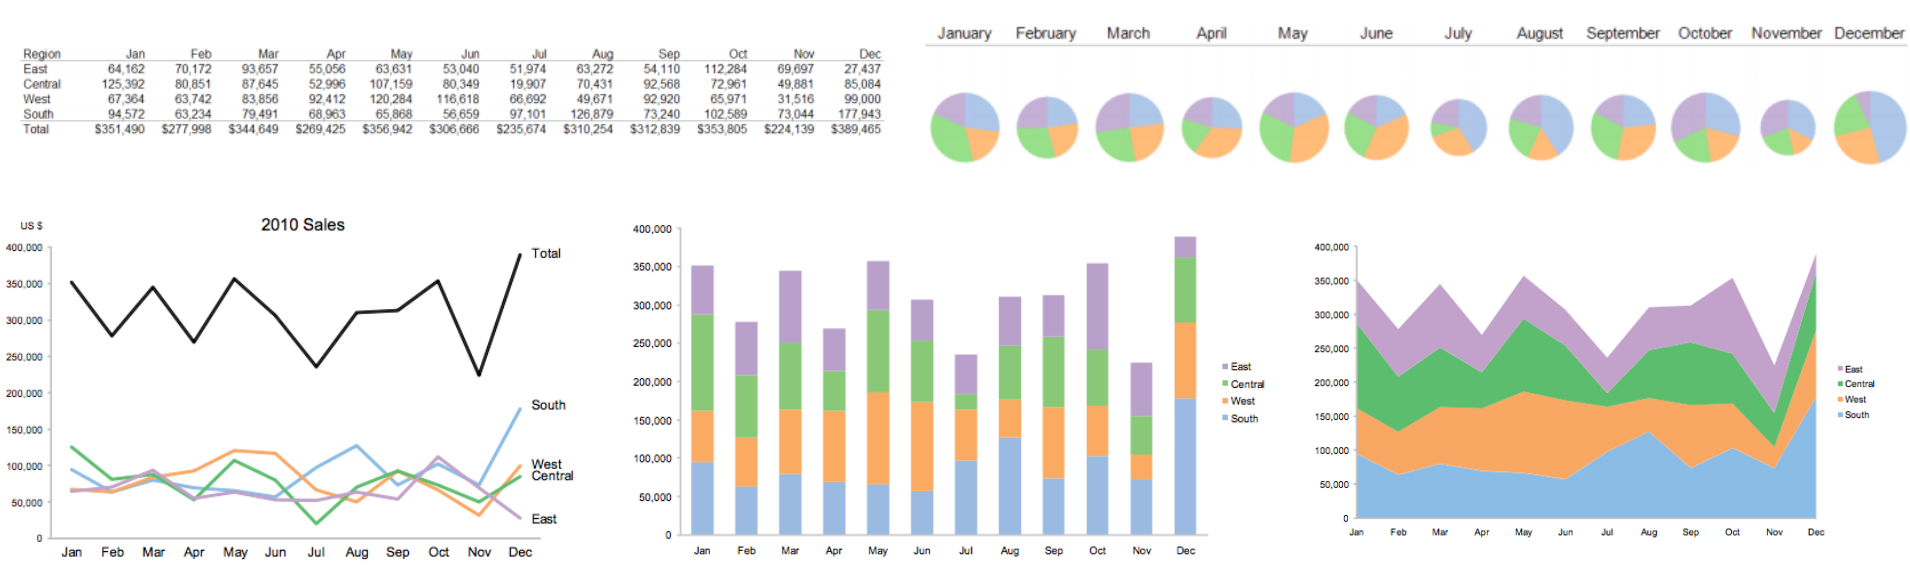
- Which one is more effective to compare sale trends across regions? Why?
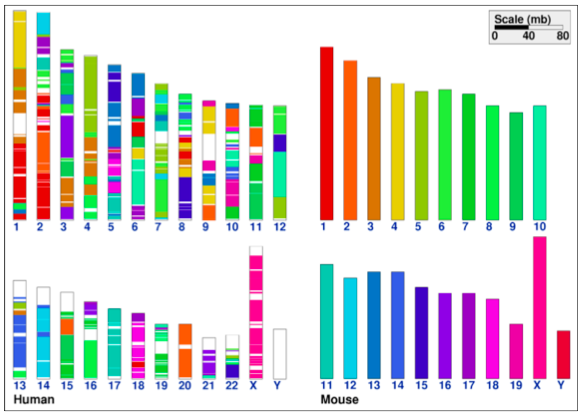
Discriminability
- How many values can we distinguish for any given channel?
- Rule: the number of available bins should match the number of bins we want to be able to see from the data

Discriminability
... or switch channels! (E.g. color-space trade-off)
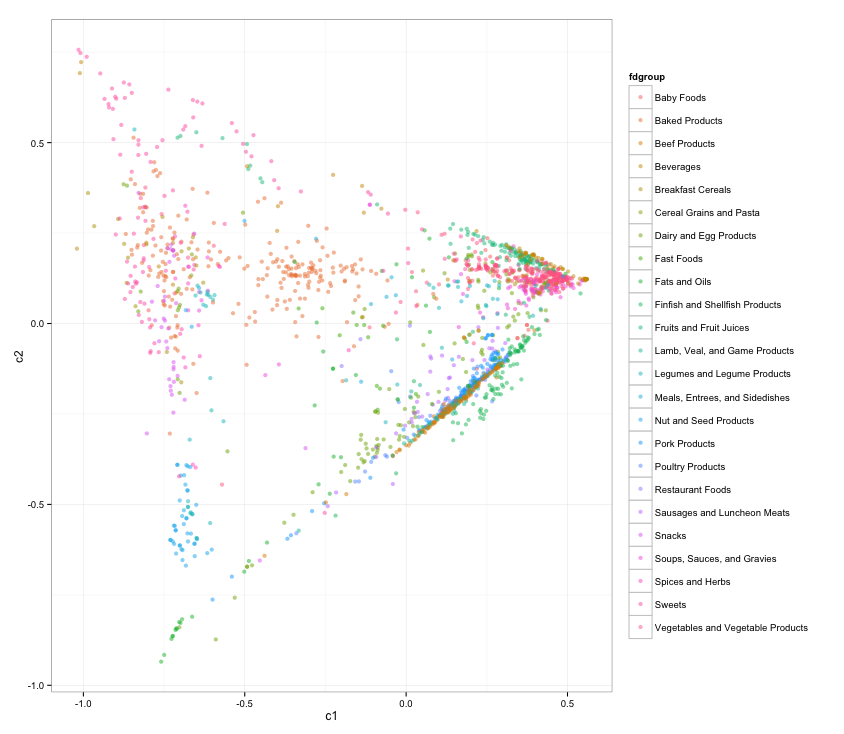
Separability
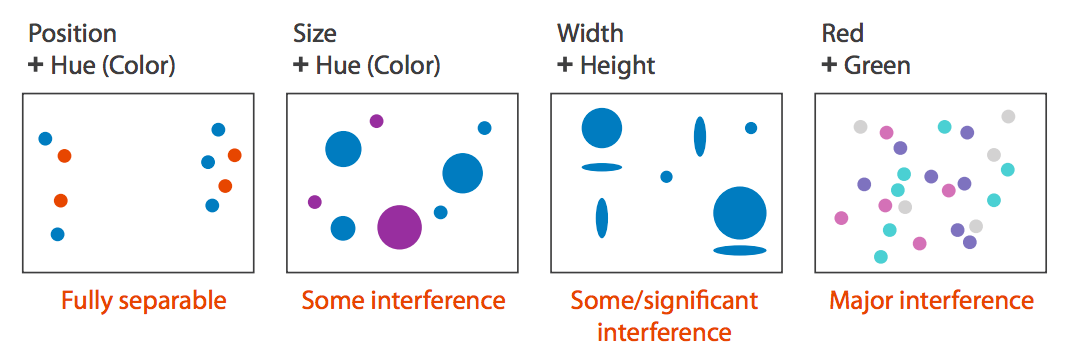
Separability

Width + height Shape + color Position + color
Separability

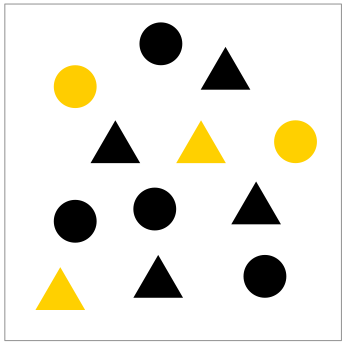
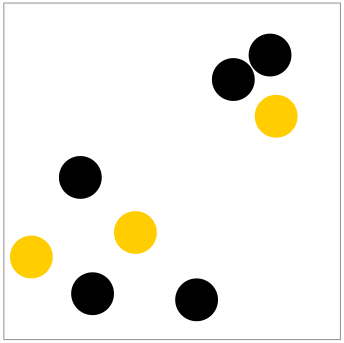
Grouping
- Containment and connection
- Proximity
- Similarity (identity)