class: center, middle, inverse, title-slide .title[ # Data Analysis and Visualization ] .subtitle[ ## Chapter 1. Fundamentals of Statistical Graphs ] .author[ ### Iñaki Úcar ] .institute[ ### Department of Statistics | uc3m-Santander Big Data Institute ] .institute[ ### Bachelor in Data and Business Analytics ] .date[ ### <p>Licensed under Creative Commons Attribution <a href="https://creativecommons.org/licenses/by/4.0/">CC BY 4.0</a> Last generated: 2025-09-06</p> ] --- class: base24, middle, clear <style>.shareagain-bar { --shareagain-foreground: rgb(255, 255, 255); --shareagain-background: rgba(0, 0, 0, 0.5); --shareagain-twitter: none; --shareagain-facebook: none; --shareagain-linkedin: none; --shareagain-pinterest: none; --shareagain-pocket: none; --shareagain-reddit: none; }</style> - [Introduction to DataViz](ch1_1.html#3) - [Graphical Integrity](ch1_2.html#3) - [Graphical Perception](ch1_3.html#3) - [Principles of Graphical Representation](ch1_4.html#3) --- class: inverse, center, middle # Graphical Integrity ## How to Lie with Graphs --- class: base24 # Bad Charts ![:vspace 50]() - We live surrounded by bad charts - For many people, statistical charts = **lie** -- ![:vspace 30]() - Deception vs. ineptitude - Lack of **quantitative skills**, _anumerism_ - Lack of knowledge about **visual perception** - Lack of **visual skills** - Intention to **deceive** --- class: base24 # Sources of Bad Charts - For Tufte: - Distortion - Data variation - Visual area and numerical measure - Context -- - But there are many more **common patterns**: - Bad representation (deception, sometimes) - Bad data - Too many data (optimism) - Too little data (optimism) - Hiding relevant data (deception) - Wrong representation (deception) - Creativity (without skill) --- # Prologue: Pie Charts .panelset[ .panel[.panel-name[See the pattern?] .center[] ] .panel[.panel-name[Second try] .center[] ] .panel[.panel-name[The only acceptable one] .center[] ] ] --- # Bad Representation: Areas .panelset[ .panel[.panel-name[See the pattern?] .center[] ] .panel[.panel-name[Second try] .center[] ] ] --- # Bad Representation: Longitudes .panelset[ .panel[.panel-name[Deception 1] - Cutting the origin is the most common deception technique with bar plots ![:vspace 50]() .pull-left[.center[]] .pull-right[.center[]] ] .panel[.panel-name[Deception 2] .center[] ] .panel[.panel-name[Ineptitude 1] .center[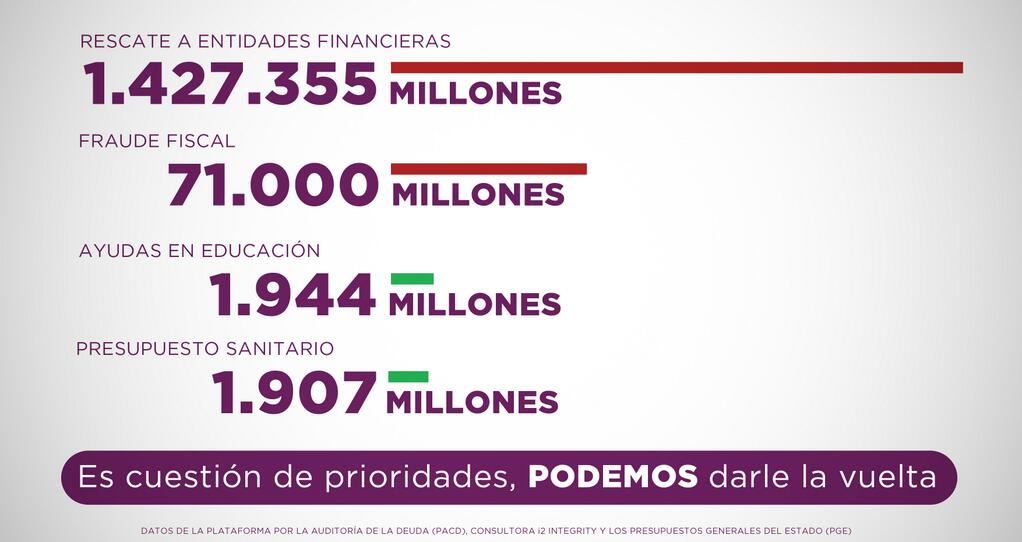] ] .panel[.panel-name[Ineptitude 2] - Some well-intentioned axis cuts may have nefarious consequences ![:vspace 50]() .pull-left[.center[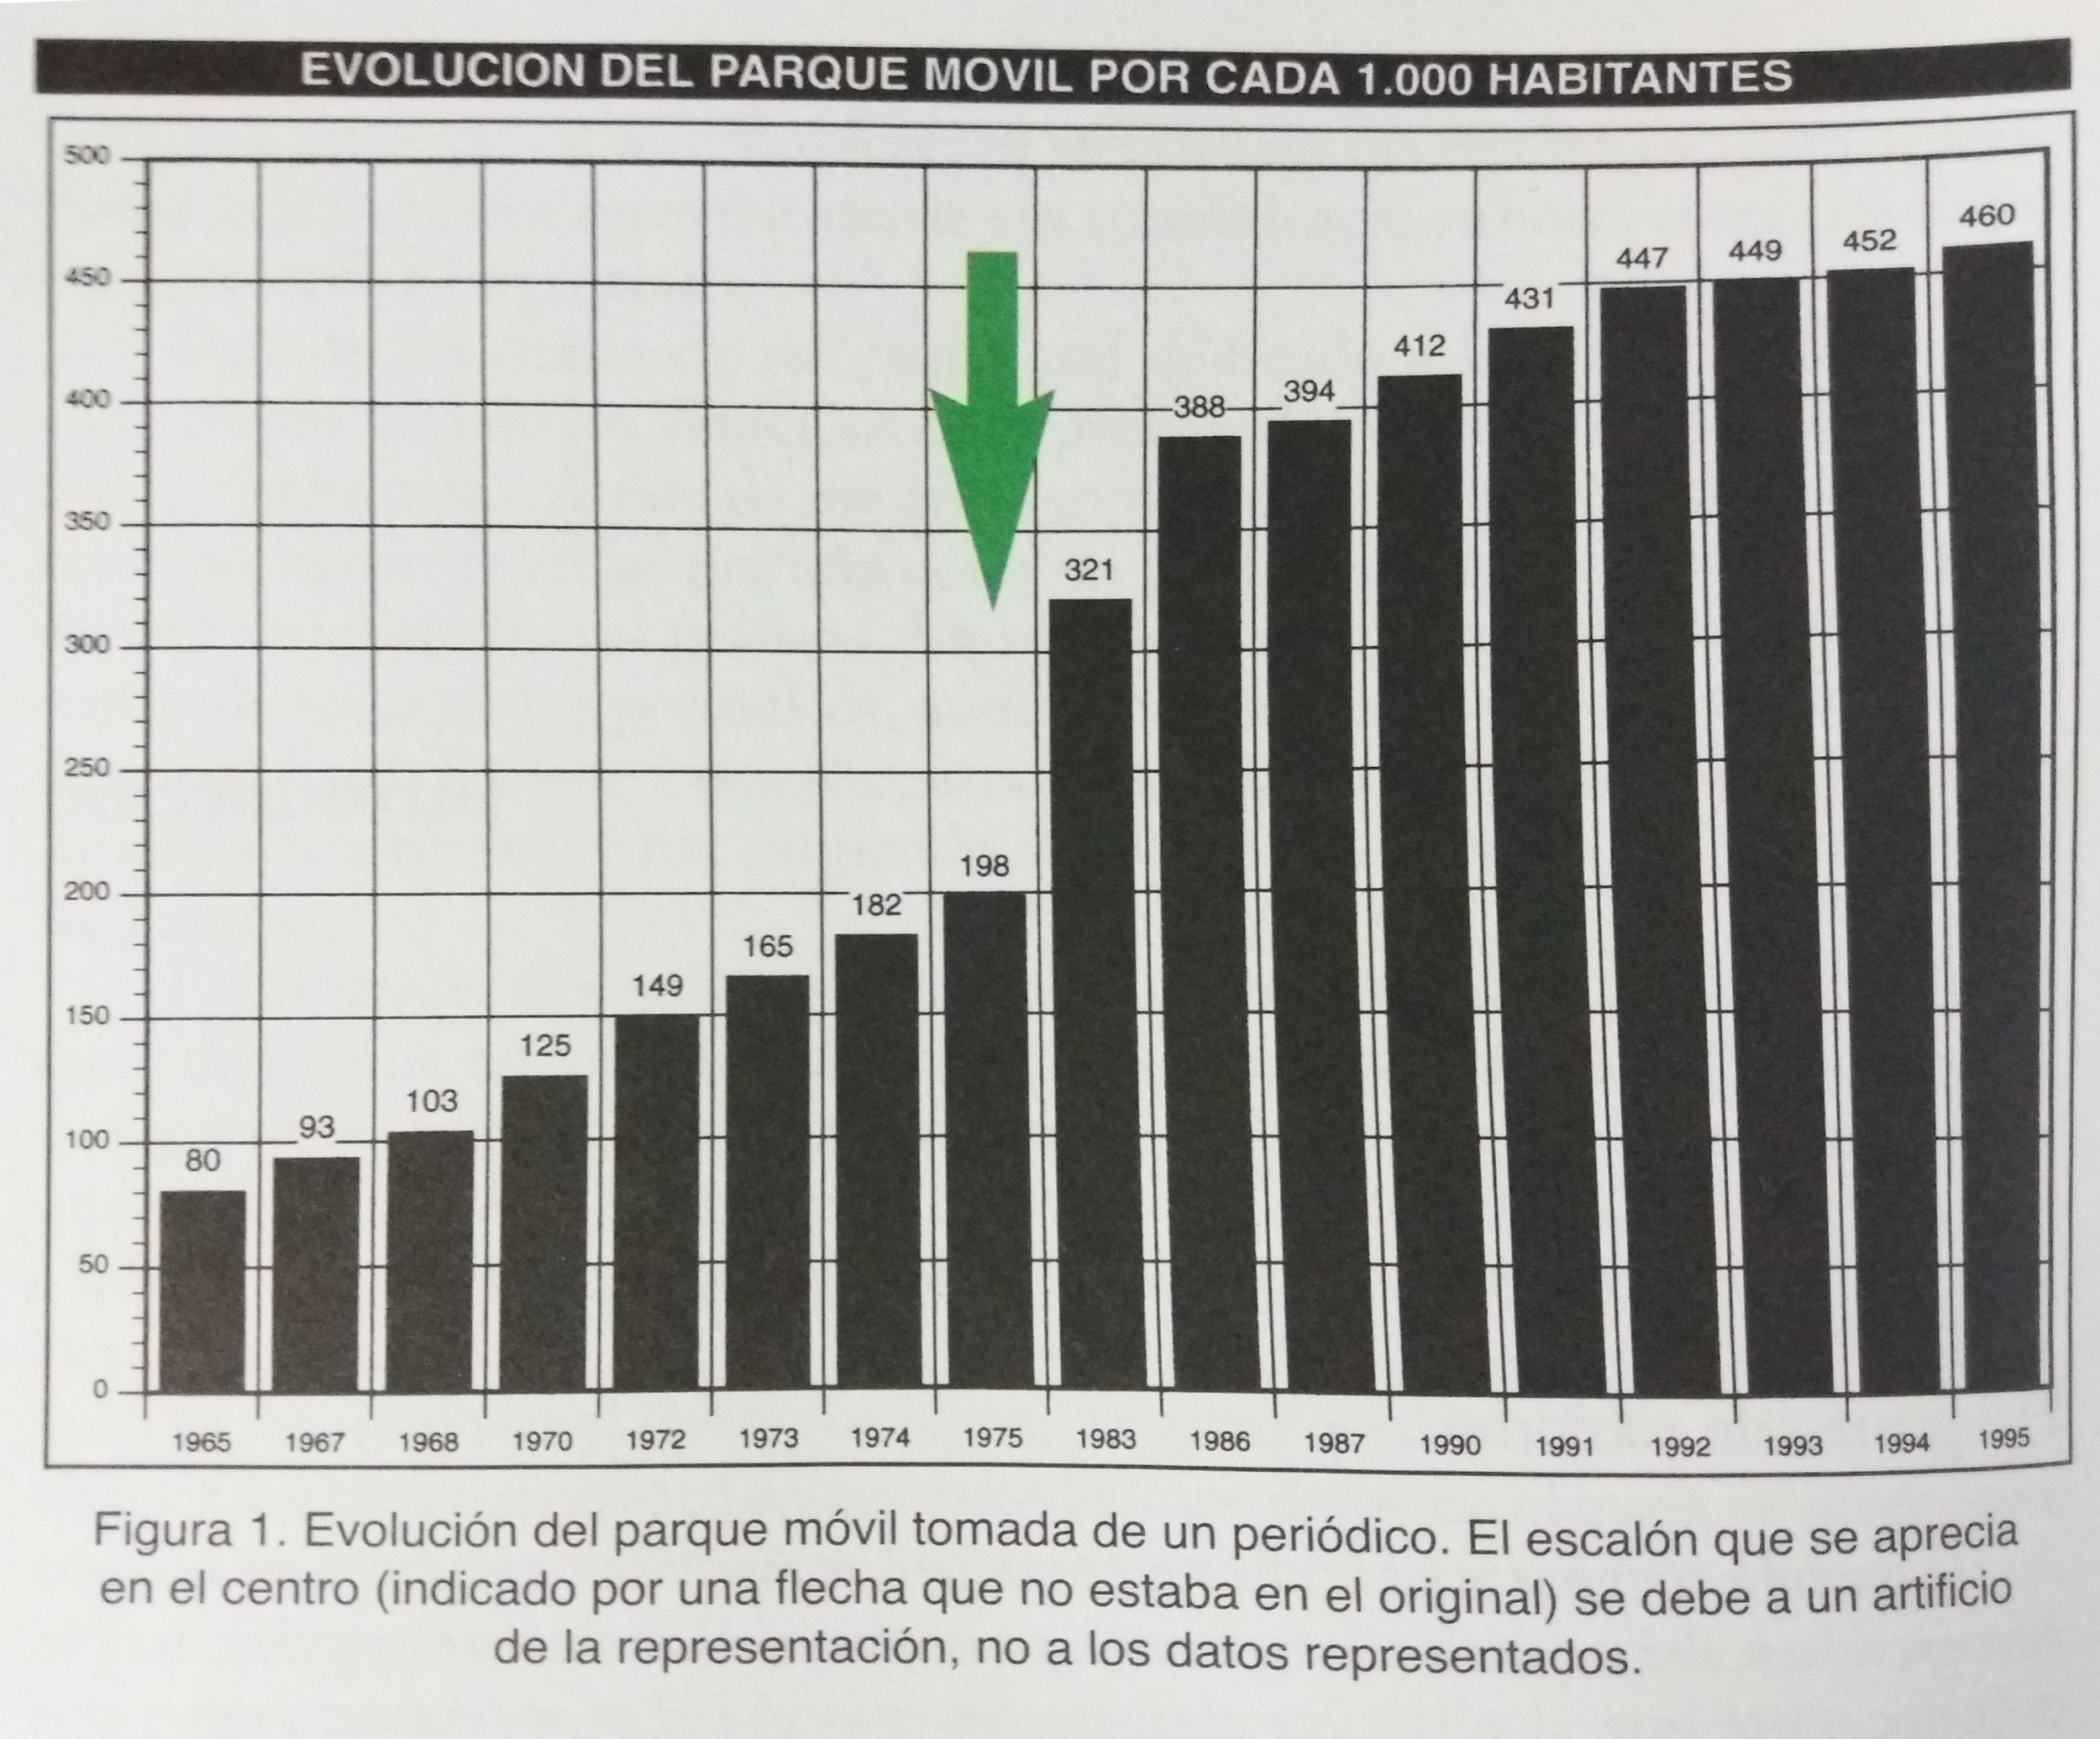]] .pull-right[.center[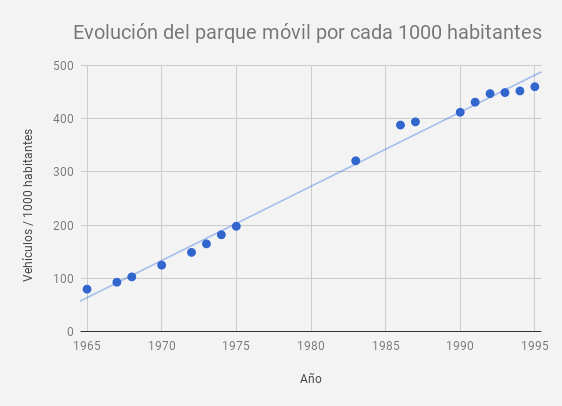]] ] ] --- # Bad Data .panelset[ .panel[.panel-name[Population maps] .center[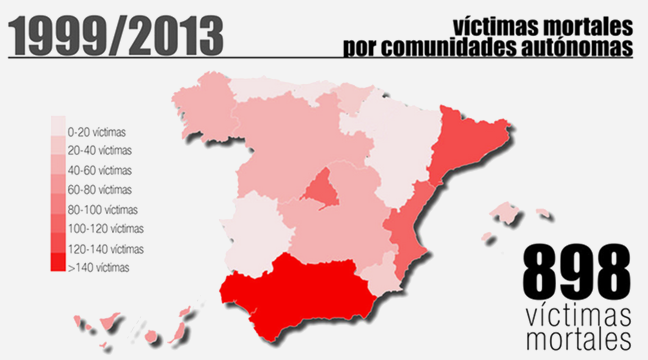] ] .panel[.panel-name[Irrelevant data] .center[] ] .panel[.panel-name[Bonus] .center[] ] .panel[.panel-name[Non-comparable] .center[] ] .panel[.panel-name[Not related] .center[] - See [Spurious correlations](https://www.tylervigen.com/spurious-correlations) for more fun ] ] --- # Too Many Data .panelset[ .panel[.panel-name[Pie horror 1] .center[] ] .panel[.panel-name[Pie horror 2] .center[] ] ] --- # Too Little Data .panelset[ .panel[.panel-name[Optimist 1] .center[] ] .panel[.panel-name[Optimist 2] .center[] ] .panel[.panel-name[Scientific optimist] .center[] ] .panel[.panel-name[+bad interpretation] .center[] ] ] --- # Hiding Relevant Data .panelset[ .panel[.panel-name[No context] ![:vspace 50]() .center[] ] .panel[.panel-name[More context] ![:vspace 50]() .center[] ] .panel[.panel-name[Complete picture] ![:vspace 50]() .center[] ] .panel[.panel-name[Context!] .center[] ] ] --- # Wrong Representation .panelset[ .panel[.panel-name[Level 1] .center[] ] .panel[.panel-name[Level 2] .center[] ] .panel[.panel-name[Level 3] .center[] ] .panel[.panel-name[Level 4] .center[] ] .panel[.panel-name[Level 5] .center[] ] .panel[.panel-name[Level 6] .center[] ] ] --- # Creativity .panelset[ .panel[.panel-name[Level 1] .center[] ] .panel[.panel-name[Level 2] .center[] ] .panel[.panel-name[Level 3] .center[] ] .panel[.panel-name[Level 4] .center[] ] .panel[.panel-name[Level 5] .center[] ] .panel[.panel-name[Level 6] .center[] ] ] --- # Bonus: Scientific Horrors .panelset[ .panel[.panel-name[3D] .center[] ] .panel[.panel-name[Linear relationship?] .center[] ] .panel[.panel-name[Quadratic relationship?] .center[] ] .panel[.panel-name[Other?] .center[] ] .panel[.panel-name[Whatever] .center[] ] ] --- # 12 Rules to Display Data Badly .footnote[Wainer, H. (1984) **How to Display Data Badly**. _The American Statistician_ 38(2), pp. 137-147.] -- .pull-left[ ### Showing data - Rule 1. Show as few data as possible (minimize the data density) - Rule 2. Hide what data you do show (minimize the data-ink ratio) ] -- .pull-right[ ### Showing data accurately - Rule 3. Ignore the visual metaphor altogether - Rule 4. Only order matters - Rule 5. Graph data out of context ] -- ### Showing data clearly - Rule 6. Change scales in mid-axis - Rule 7. Emphasize the trivial (ignore the important) - Rule 8. Jiggle the baseline - Rule 9. Austria first! - Rule 10. Label illegibly, incompletely, incorrectly, and ambiguously - Rule 11. More is murkier: more decimal places and more dimensions - Rule 12. If it has been done well in the past, think of another way to do it --- # Chart Rethinking: Exercise 1 .footnote[https://junkcharts.com] .panelset[ .panel[.panel-name[Original] .center[] ] .panel[.panel-name[Iteration 1] .center[] ] .panel[.panel-name[Iteration 2] .center[] ] ] --- # Chart Rethinking: Exercise 2 .footnote[https://junkcharts.com] .panelset[ .panel[.panel-name[Original] .center[] ] .panel[.panel-name[Iteration 1] .center[] ] .panel[.panel-name[Iteration 2] .center[] ] ] --- # Chart Rethinking: Exercise 3 .footnote[https://www.datanalytics.com/] .panelset[ .panel[.panel-name[Original] .center[] ] .panel[.panel-name[Original] .center[] ] .panel[.panel-name[Iteration 1] .center[] ] ] --- # Chart Rethinking: Exercise 4 .footnote[https://junkcharts.com] .panelset[ .panel[.panel-name[Original] .center[] ] .panel[.panel-name[Iteration 1] .center[] ] ] --- # Chart Rethinking: Exercise 5 .footnote[https://junkcharts.com] .panelset[ .panel[.panel-name[Original] .center[] ] .panel[.panel-name[Iteration 1] .center[] ] .panel[.panel-name[A word of caution] .center[] ] ] --- # Chart Rethinking: Exercise 6 .footnote[Schwabish, J. A. (2014). _An Economist’s Guide to Visualizing Data_] .panelset[ .panel[.panel-name[Original] .center[] ] .panel[.panel-name[Iteration 1] .center[] ] ] --- # Chart Rethinking: Exercise 7 .footnote[Schwabish, J. A. (2014). _An Economist’s Guide to Visualizing Data_] .panelset[ .panel[.panel-name[Original] .center[] ] .panel[.panel-name[Iteration 1] .center[] ] ] --- # Chart Rethinking: Exercise 8 .footnote[Schwabish, J. A. (2014). _An Economist’s Guide to Visualizing Data_] .panelset[ .panel[.panel-name[Original] .center[] ] .panel[.panel-name[Iteration 1] .center[] ] ] --- class: base24 # Summary -- - We live surrounded by **bad charts**, either by deception or ineptitude. -- - There are some **common patterns** to be aware of.<br> From those, we can distill a series of **basic rules**: -- - Pie charts are very rarely justified. - Areas are tricky. - 3D is rarely justified in 2D mediums. - Axes (cuts, scales...) should be clear. - Proper context should be shown when relevant. - Do not go beyond what data tells. - There are **well-established visual metaphors**. - E.g. up-down for positive-negative. - E.g. areas are perceived as whole quantities,<br> so cutting the axis is deceiving.